
Stop Monitoring AI Systems Like Web Services
Five questions every AI system has to answer, and the metrics that answer them.

👋 I am Aurimas. I write the SwirlAI Newsletter with the goal of presenting complicated Data related concepts in a simple and easy-to-digest way. My mission is to help You UpSkill and keep You updated on the latest news in AI Engineering, Data Engineering, Machine Learning and overall Data space.
Many AI systems are still monitored like the web services they sit next to. The API gateway emits uptime, error rates, and latency percentiles, the dashboards come free with the infrastructure. Unfortunately, none of those numbers can tell you that users stare at a blank screen for four seconds before the first token is displayed, or that token spend per task has doubled since the last prompt update, or that the model has started inventing answers around the retrieved context instead of from it.
The gap exists because an LLM system breaks the assumptions web monitoring was built on. Responses are generated token by token, so “latency” is at least three different numbers depending on where on the timeline you stand. Cost scales with tokens rather than requests. Also, the most damaging failures are silent: a quality regression does not throw a 500, it returns confident text with a 200 status code.
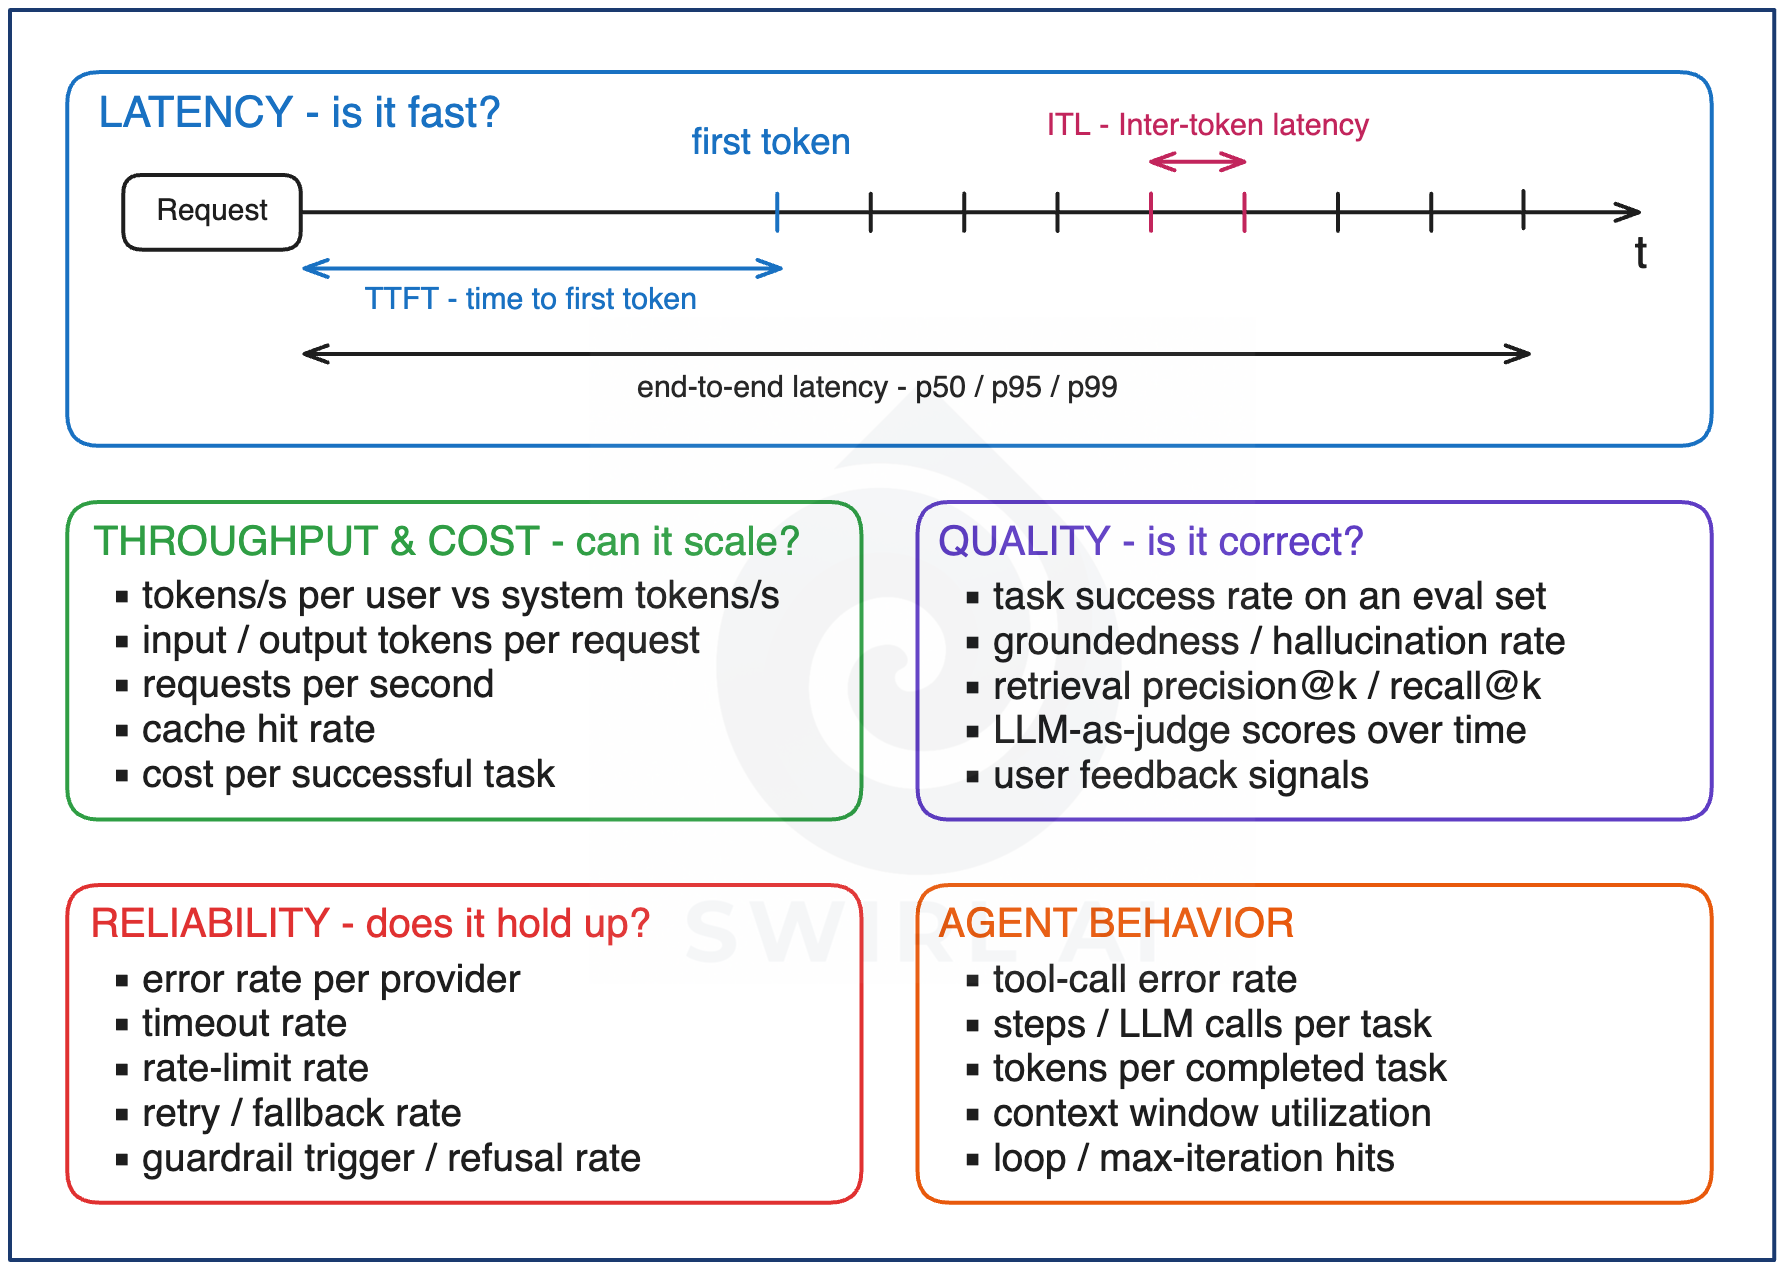
For me personally it helps to group metrics by the question they answer. Five questions cover most of what goes wrong in production: is it fast, can it scale, is it correct, does it hold up, and when there is an agent in the loop, how does it behave. This article walks through each group, what the metrics mean mechanically, and which ones you have to build yourself because nothing emits them by default.
Before moving to the questions, next week on Thursday I will be running a workshop - From AI Demo to Deployed App.
AI engineers can build the backend, but most stop when it’s time to put a usable frontend in front of real users.
Join me and learn how to:
Port a Streamlit prototype or a vibecoded frontend app to v0
Ship the app to production on Vercel
Ship a new UI feature on top of an existing backend
June 18th, 15:00 GMT
Is It Fast? (Latency)
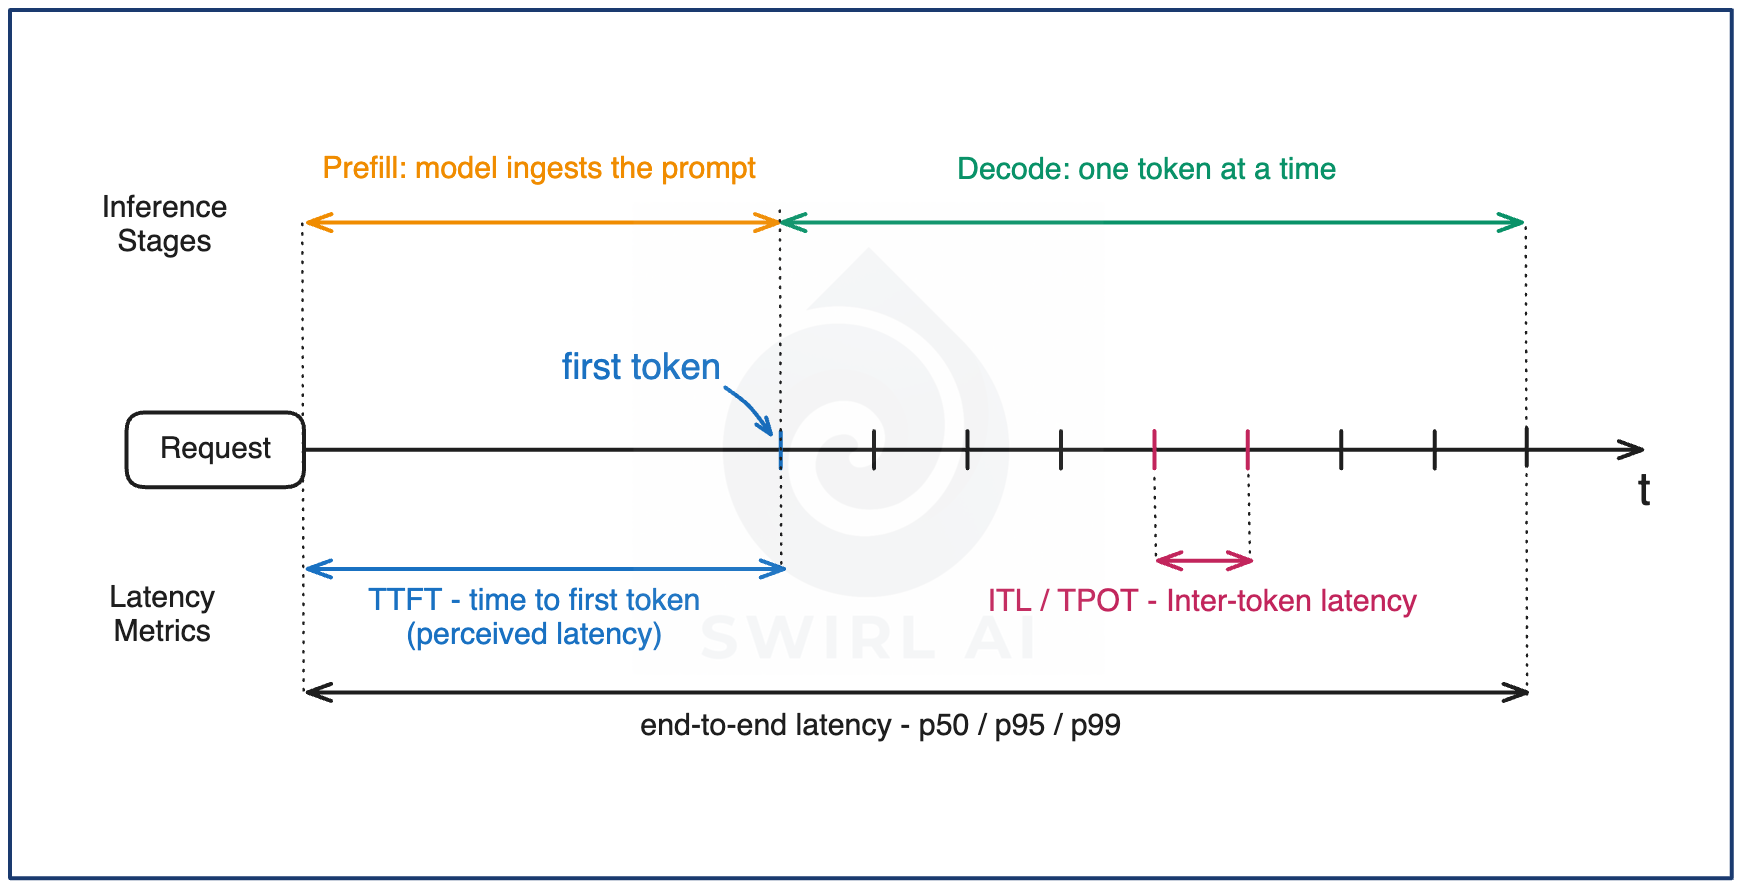
An LLM request has two phases, and they produce different latency numbers. During prefill the model ingests the entire prompt and builds its internal state, with nothing visible to the user while it happens. During decode the model generates output one token at a time. Every latency metric worth tracking is a position on that timeline.
Time to first token (TTFT) is the amount of time from sending the request to the first token arriving, which is queueing time plus prefill. In a streaming UI this is the number users feel (perceived latency), because it is exactly how long they look at a blank screen. TTFT grows with prompt length, which is why RAG systems that pack large contexts into the prompt pay for it in perceived speed.
Inter-token latency (ITL, also reported as time per output token, TPOT) is the gap between consecutive tokens once streaming starts, and it determines whether output reads as flowing text properly. Users tolerate a slow but steady stream far better than a fast one that freezes.
End-to-end latency at p50, p95, and p99 is the full span, and output length dominates it. That makes a single global percentile close to meaningless: it averages 50-token classification calls with 2,000-token report generations. Track end-to-end latency per use case, so each number has one workload behind it.
Agents add a compounding effect. A task that chains several sequential LLM calls multiplies the per-call numbers, and a tolerable per-call p95 can become an intolerable task-level latency. For agentic workloads, set the latency budget at the task level and let it constrain the steps.
Can It Scale? (Throughput and Cost)
Tokens per second per user versus total system throughput. Serving systems batch concurrent requests on the same hardware, and the batch size is what you can adjust: larger batches improve total system tokens per second while each individual stream slows down. The two metrics trade off against each other on the same GPUs. So decide per workload which one you are protecting. Interactive chat should favour per-user speed, offline batch processing should favour total throughput.
Input and output tokens per request. There is not much to add here, it is the core of unit economics, with output tokens typically priced at a multiple of input tokens. Log both per request, break down by use case, monitor carefully.
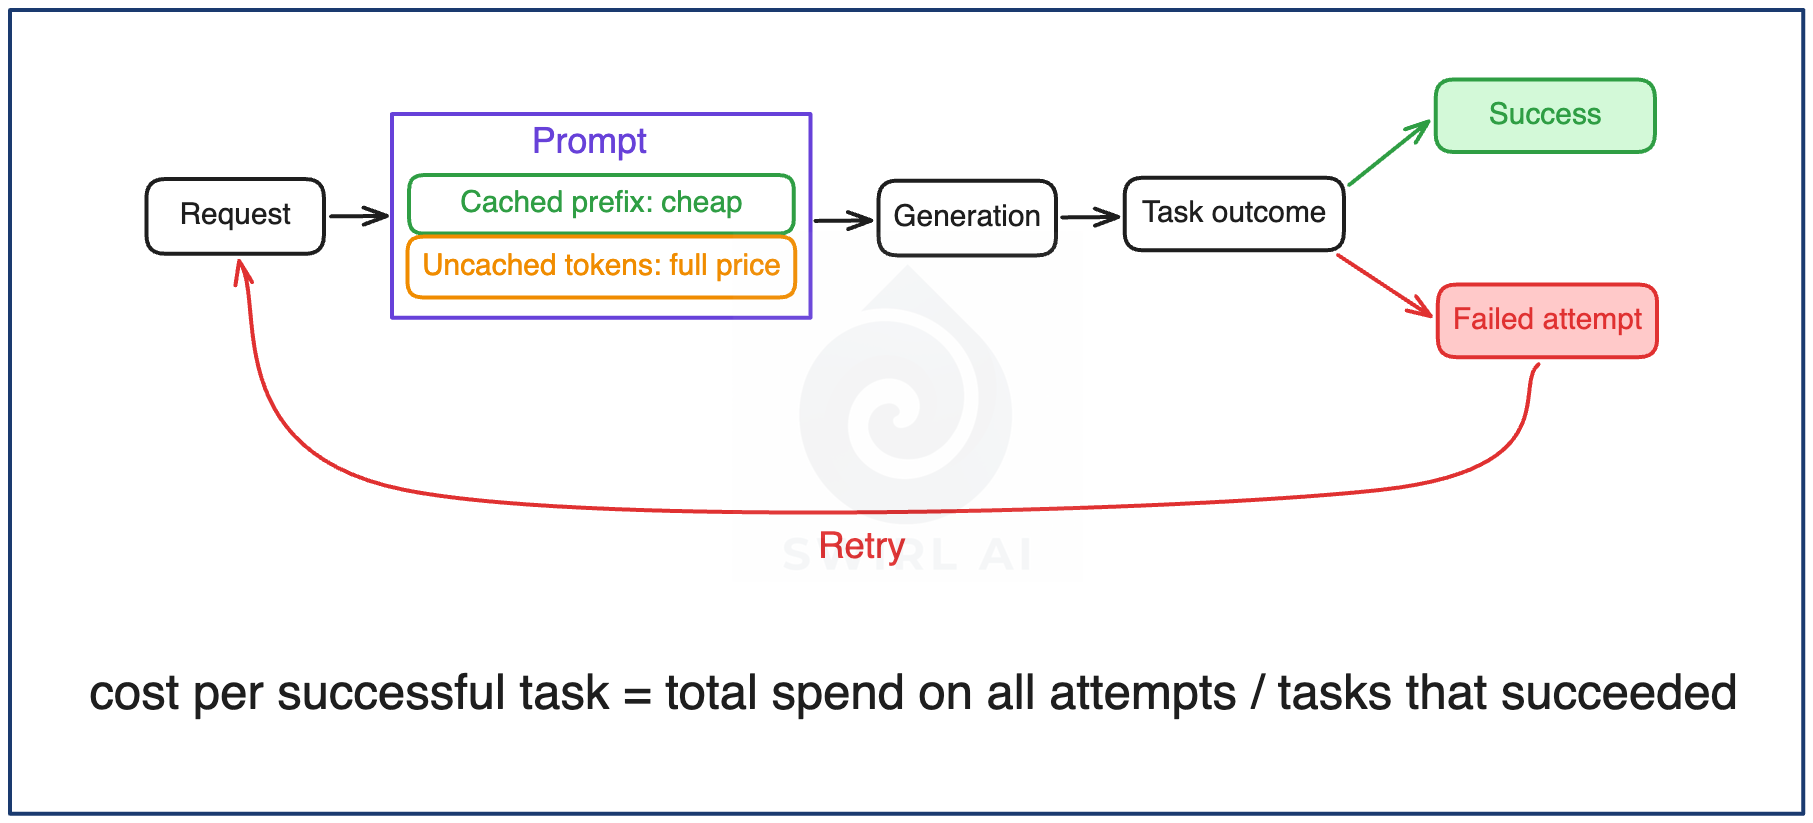
Cache hit rate. Prompt caching makes repeated prompt prefixes dramatically cheaper to process, it is one of the largest single cost levers in systems with stable system prompts, tool definitions, or shared document context. It is also easy to get wrong, because caching matches the prompt prefix byte for byte: a timestamp interpolated near the front of the prompt, or a reordered tool list invalidates the cache. Monitor for falling cache hit rate, it can signal that someone changed how prompts are assembled.
Cost per successful task, not cost per request. Cost per request makes systems that fail cheaply look good. A request that costs a third as much but succeeds half as often is more expensive where it counts, and failed attempts trigger retries that multiply spend invisibly. This is also the connective metric across all five groups: you can push latency, cost, or quality in isolation, and cost per successful task is the number that tells you whether the system as a whole got better or worse.
Is It Correct? (Quality)
Nothing in the serving stack emits correctness. Every metric in this group you build yourself.
Task success rate on a labeled eval set. A few dozen to a few hundred examples with known good outcomes, re-run on prompt changes, model upgrade, and retrieval change. This is the regression suite of an AI system. The set does not need to be large to be useful, it needs to be representative and maintained.
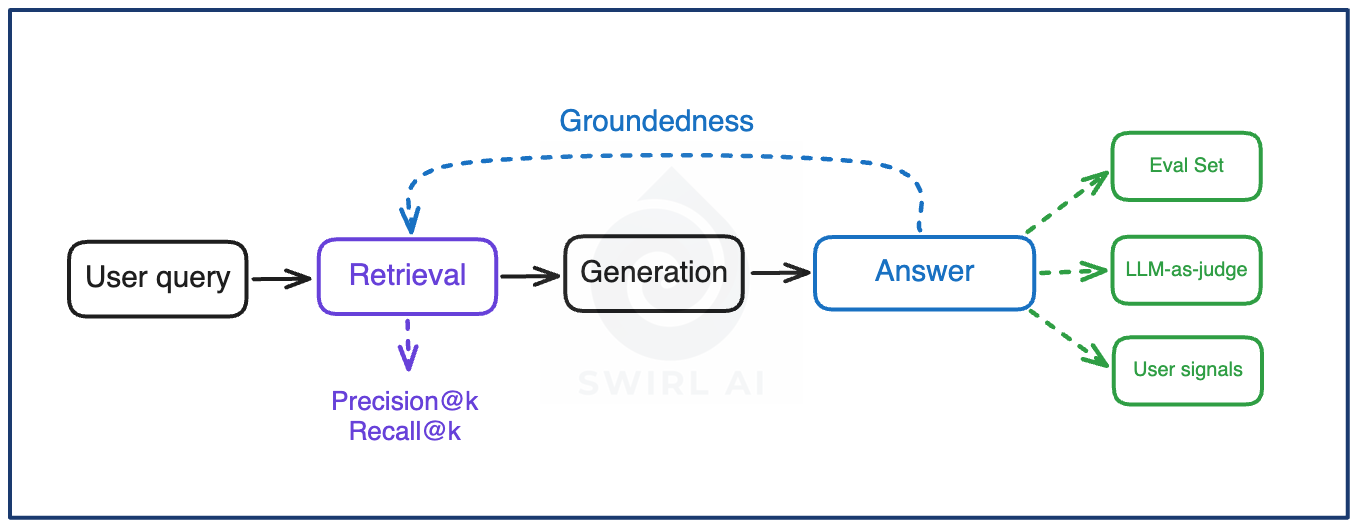
Groundedness for RAG. Is the answer supported by the retrieved context, or invented around it? A system can have excellent retrieval and still hallucinate between what was retrieved and what was written. This is becoming a lot less of a problem with powerful models, but in real production systems you eventually want to use the smallest models possible to reduce cost.
Retrieval precision and recall @ k. Of the k chunks retrieved, precision@k asks how many were actually relevant. Recall@k asks how much of the relevant material made it into those k in the first place. Generation cannot fix what retrieval never surfaced, so when answer quality drops, check the retrieval metrics before rewriting prompts. Retrieval is still the harder problem in AI systems.
LLM-as-judge scores over time, calibrated against human labels. Judges make quality measurable at volume, and they drift - a judge model upgrade can change scores with no change in the system being tested. Calibrate against a sample of human labels at the start, and re-calibrate whenever the judge model changes or the score trend looks too good.
User feedback signals. Explicit thumbs are rare and biased toward the extremes. Regeneration rate and how heavily users edit generated output before accepting it are more often and honest, because they are recorded at the moment the user acts on the output rather than when they feel like rating it.
Learn more about the lifecycle of AI System development utilising Quality metrics in my previous article:

Does It Hold Up? (Reliability)
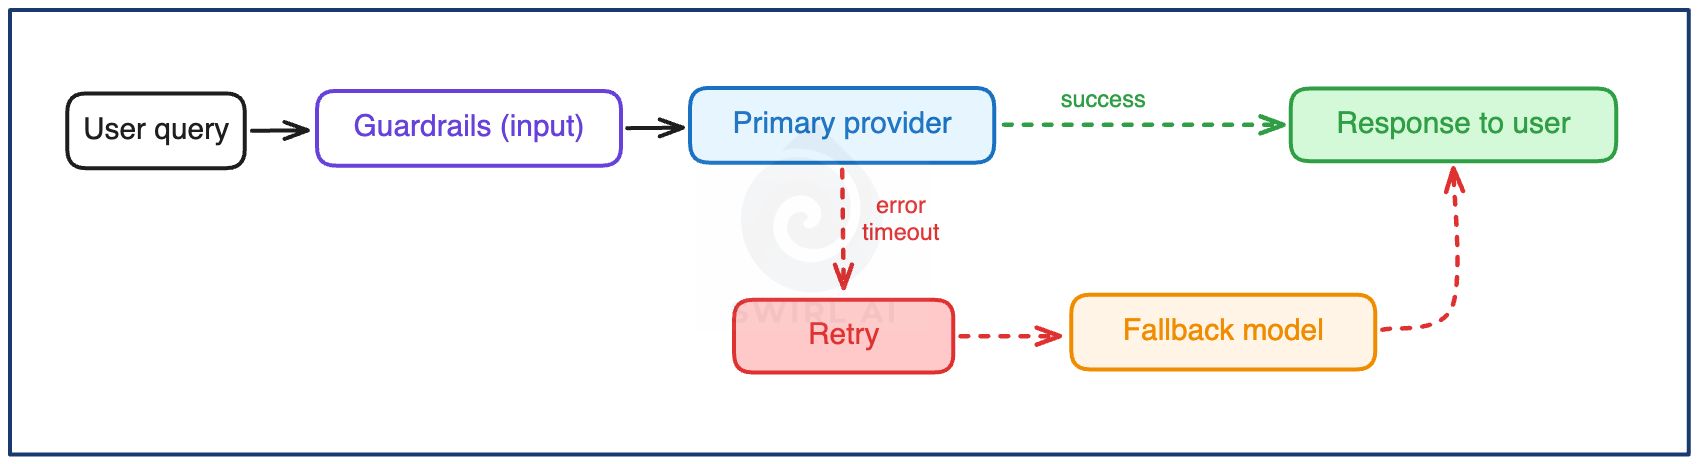
Error, timeout, and rate-limit rates per provider. The per-provider split matters because aggregate availability hides which dependency is degrading, and rate limits in particular tend to arrive in bursts tied to one provider’s quota.
Retry and fallback rate. Falling back to a backup model keeps availability green while quality quietly changes. Track quality metrics per serving path..
Guardrail trigger and refusal rates. A spike in either means user behavior drifted, an injection attempt might be happening, or a model change moved the refusal boundary. In any case, it’s worth tracking all and it is cheap once the guardrail actions are properly logged.
Learn more about how to measure your AI systems hands-on in my End-to-End AI Engineering Bootcamp.
Kicking off in a week.
Apply code LASTCHANCE15 for 15% off.
How Does Your Agent Behave? (Agent Metrics)
Agents fail in ways single LLM calls will not, because the model makes a sequence of decisions and each one can quietly degrade.
Tool-call error rate, split by cause. Schema and argument errors mean the model misunderstands the tool, and the fix is in the tool description. Execution errors mean the tool itself broke, and the fix is in your code.
Steps and tokens per completed task. Success rate holding steady while steps per task increase means cost is rising while accuracy does not. Watch this after every model swap and prompt change.
Context window utilization. The early warning for compaction and truncation issues. Quality usually degrades while the context fills, so a utilization trend tells you to intervene while the failure is still invisible to users.
I wrote about the state of context engineering in 2026 in one of my latest articles:

Loop detection. The rate at which an agent repeats an identical tool call with identical arguments. A loop is pure token burn, and it is detectable from the trajectory log with a few lines of code.
The Instrumentation Gap
Looking back across the five groups a pattern is clear. Latency and reliability show up on day one, because the gateway, the load balancer, and the provider SDK emit them as a side effect of serving traffic. Quality, cost per task, and agent behavior metrics are not produced until you build the pipeline that measures them: token and cache fields logged from every response, an eval set that runs on every change, a judge with calibration, trajectory logs for agents.
This is also why thorough monitoring and real blind spots coexist so often: the monitoring covers the dimensions the infrastructure reports, and the failures sit in the dimensions it does not. The consequence is problems in budgeting. Instrumentation for quality and cost per task belongs in the initial build estimate for an AI feature, not in a later review.
Where to Start
You should not slow down your development efforts by trying to implement all of the measures at once. An order that provides most information per effort:
TTFT and end-to-end latency, per use case. If you stream, TTFT is the users perceived latency, both come from timestamps you already have.
Tokens per request and cache hit rate. Both are fields on the API response, logging them is easy, and they make unit economics clearer immediately.
A labeled eval set with task success rate. Start with fifty examples and the discipline to re-run on every relevant change.
Per-provider error and fallback rates. Cheap to add, and the fallback-quality interaction is a common silent degradations.
Agent metrics, when you ship an agent. Tool-call errors split by cause, steps per task, and context utilizationcan all be found in the trajectory log.
This list is representative rather than exhaustive. It deliberately leaves out GPU-level serving metrics (KV cache utilization, batch occupancy) that matter when you host inference yourself (I will cover these in a separate article), embedding and data drift, and business-layer metrics such as containment rate or revenue per session.
Takeaways
Group metrics by the question they answer. Is it fast, can it scale, is it correct, does it hold up, how does the agent behave.
Track latency as positions on the request timeline. TTFT for perceived speed, ITL for stream smoothness, end-to-end per use case. A single global p95 describes none of your workloads.
Make cost per successful task the connective number. It is the one metric that joins latency, cost, and quality.
Budget in instrumentation work, not just dashboard work. Quality, cost per task, and agent behavior emit nothing by default.
Hope you found the article useful and see you in the next one!