

👋 I am Aurimas. I write the SwirlAI Newsletter with the goal of presenting complicated Data related concepts in a simple and easy-to-digest way. My mission is to help You UpSkill and keep You updated on the latest news in AI Engineering, Data Engineering, Machine Learning and overall Data space.
Most agentic systems ship with a small initial eval set, accumulate production failures the eval set does not catch, and end up getting debugged from forwarded user complaints. Adding more evals up front does not solve this, because the failure modes that matter are the ones traffic shows you, not the ones you can guess.
What works is a lifecycle that turns each of the group of feedback into an input the system can use: traffic into evals, drift into signals, unexpected error modes into regression tests.
I gave a 40-minute version of this argument at the Vilnius AI Summit in April. The piece below is the same argument with the diagrams from that talk.
I will be running a free hands-on online worksop on evals this Thursday (May 28th).
I will get my hands dirty and we will look into how an AI Engineers work really looks like. Going from the trace analysis to identifying a problem to writing an eval for it and finally fixing the issue (or part of it).
In the session you will:
Learn how to spot the failure modes your agents will hit in production
Catch a real agent failure and fix it live with evals
Build evals into your agent iteration loop
Hope to see you online!
The lifecycle in one diagram
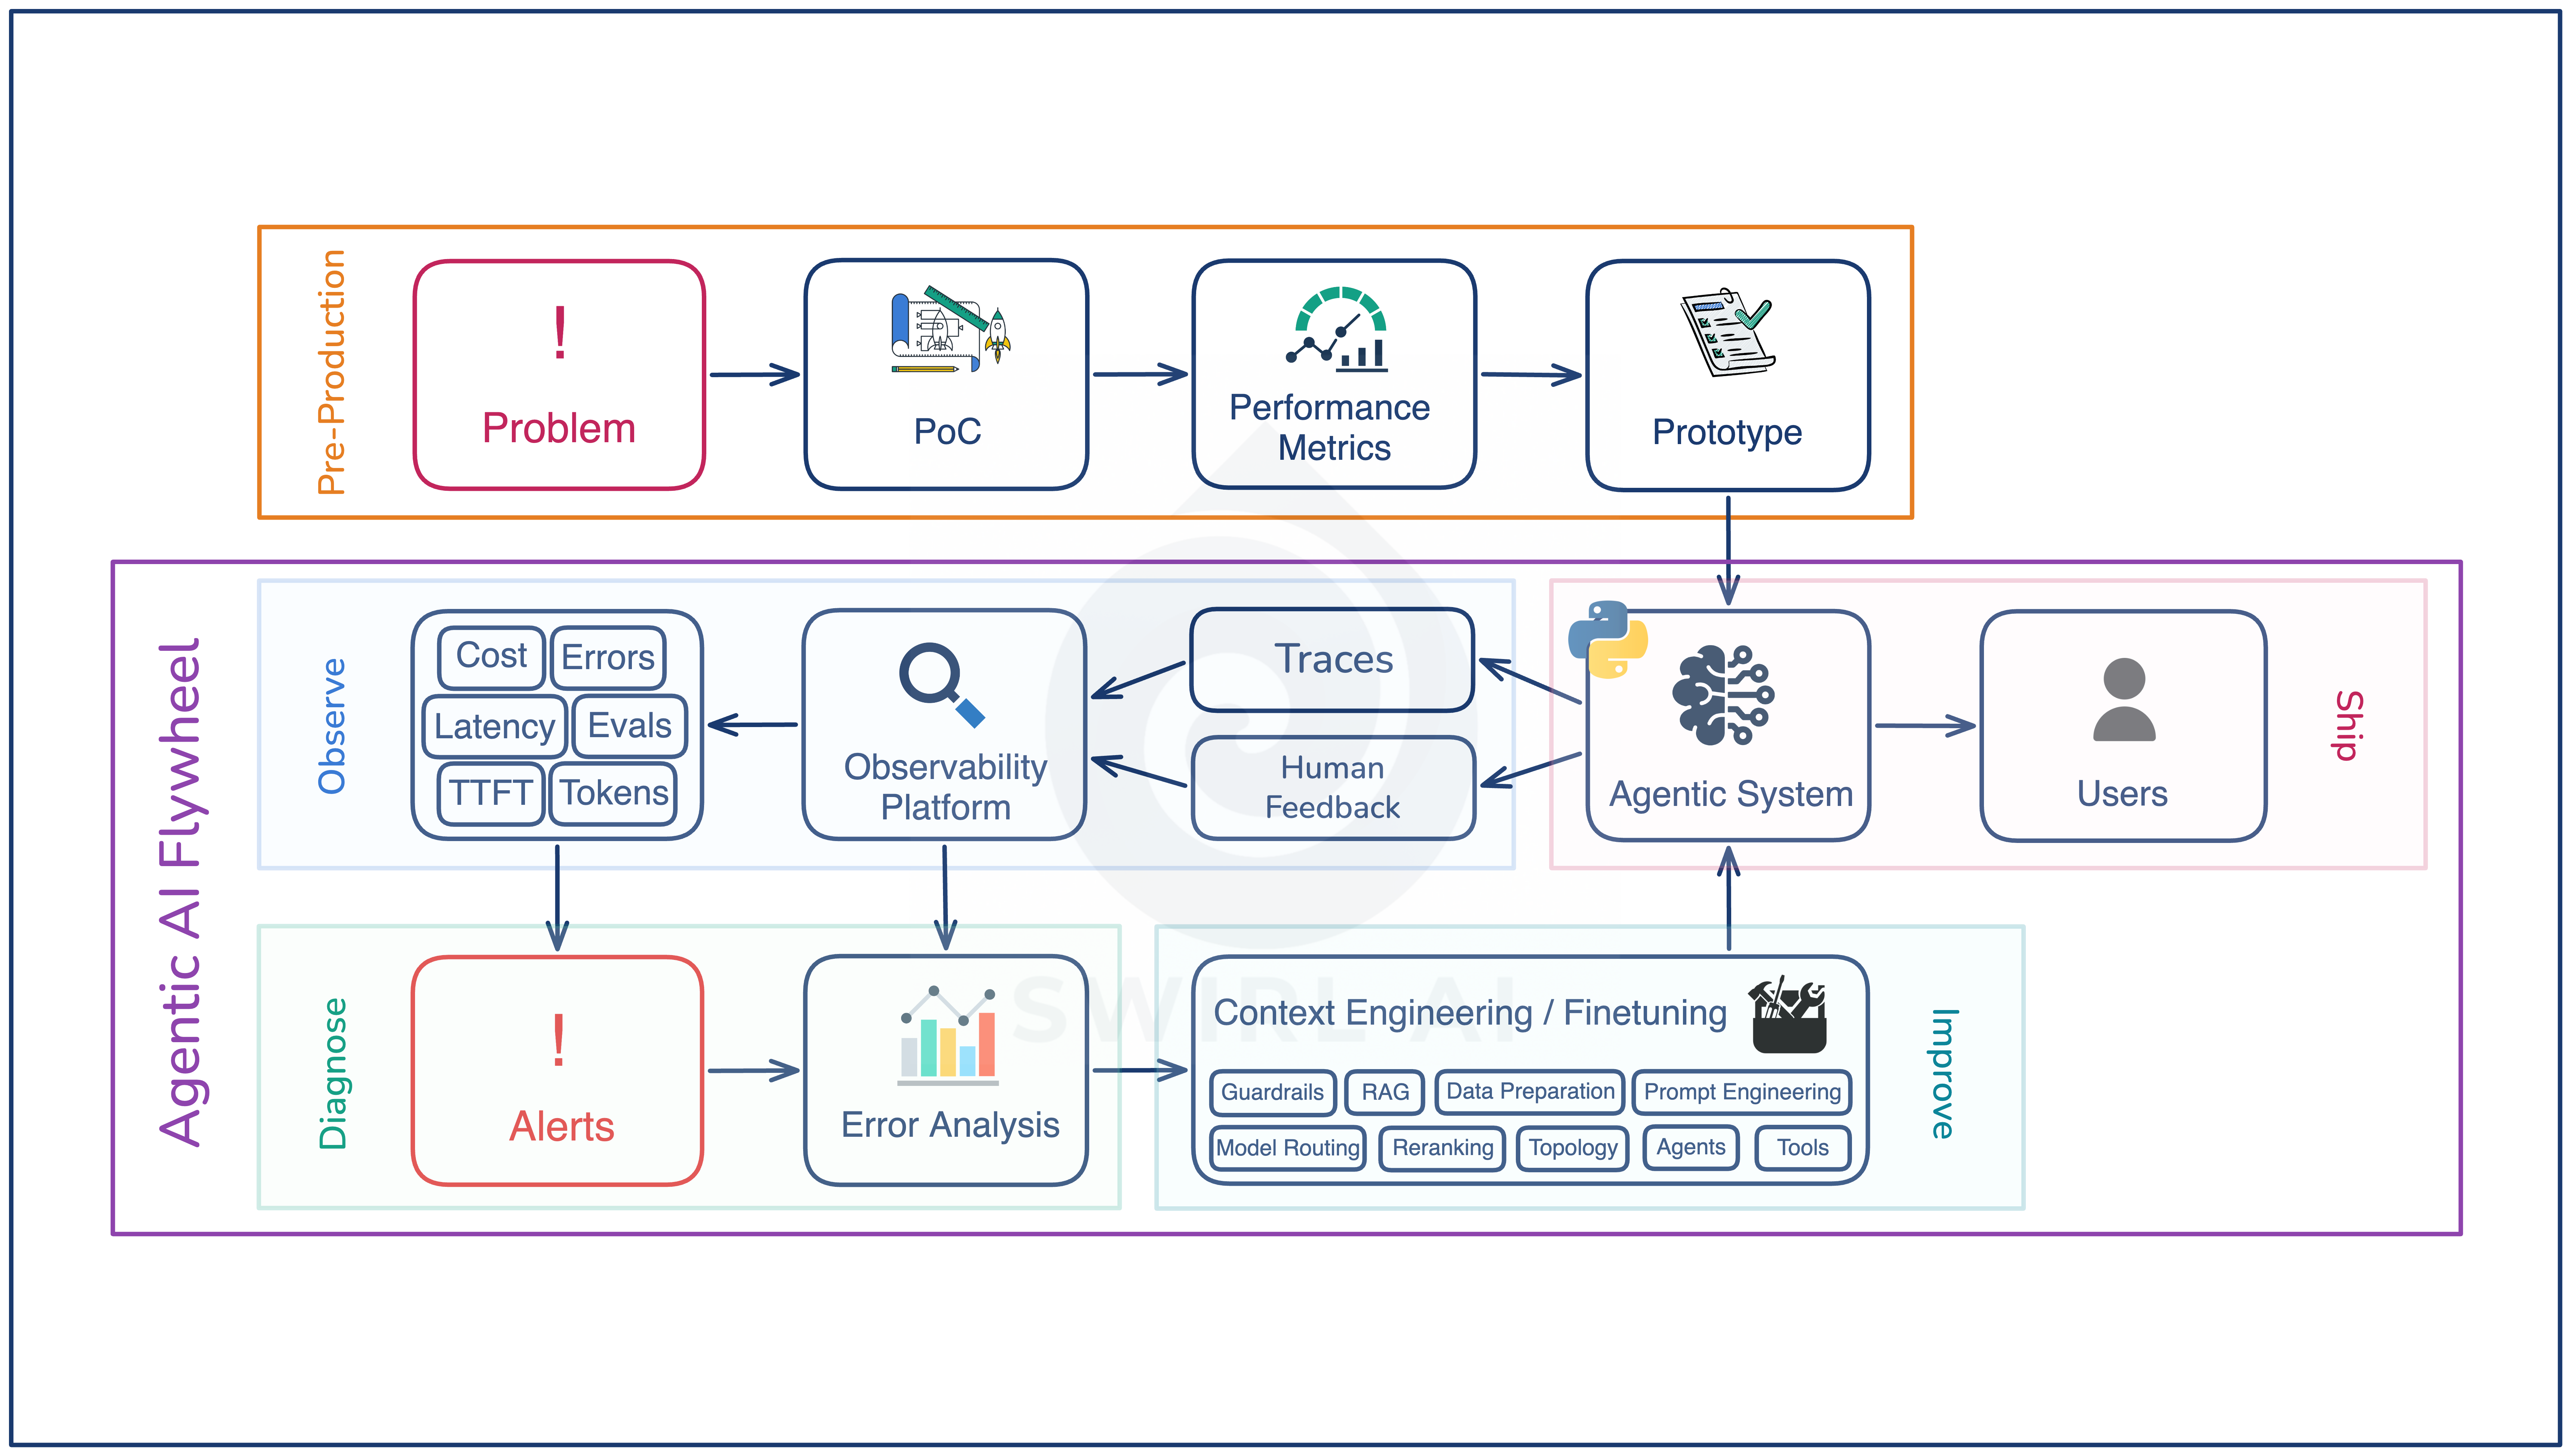
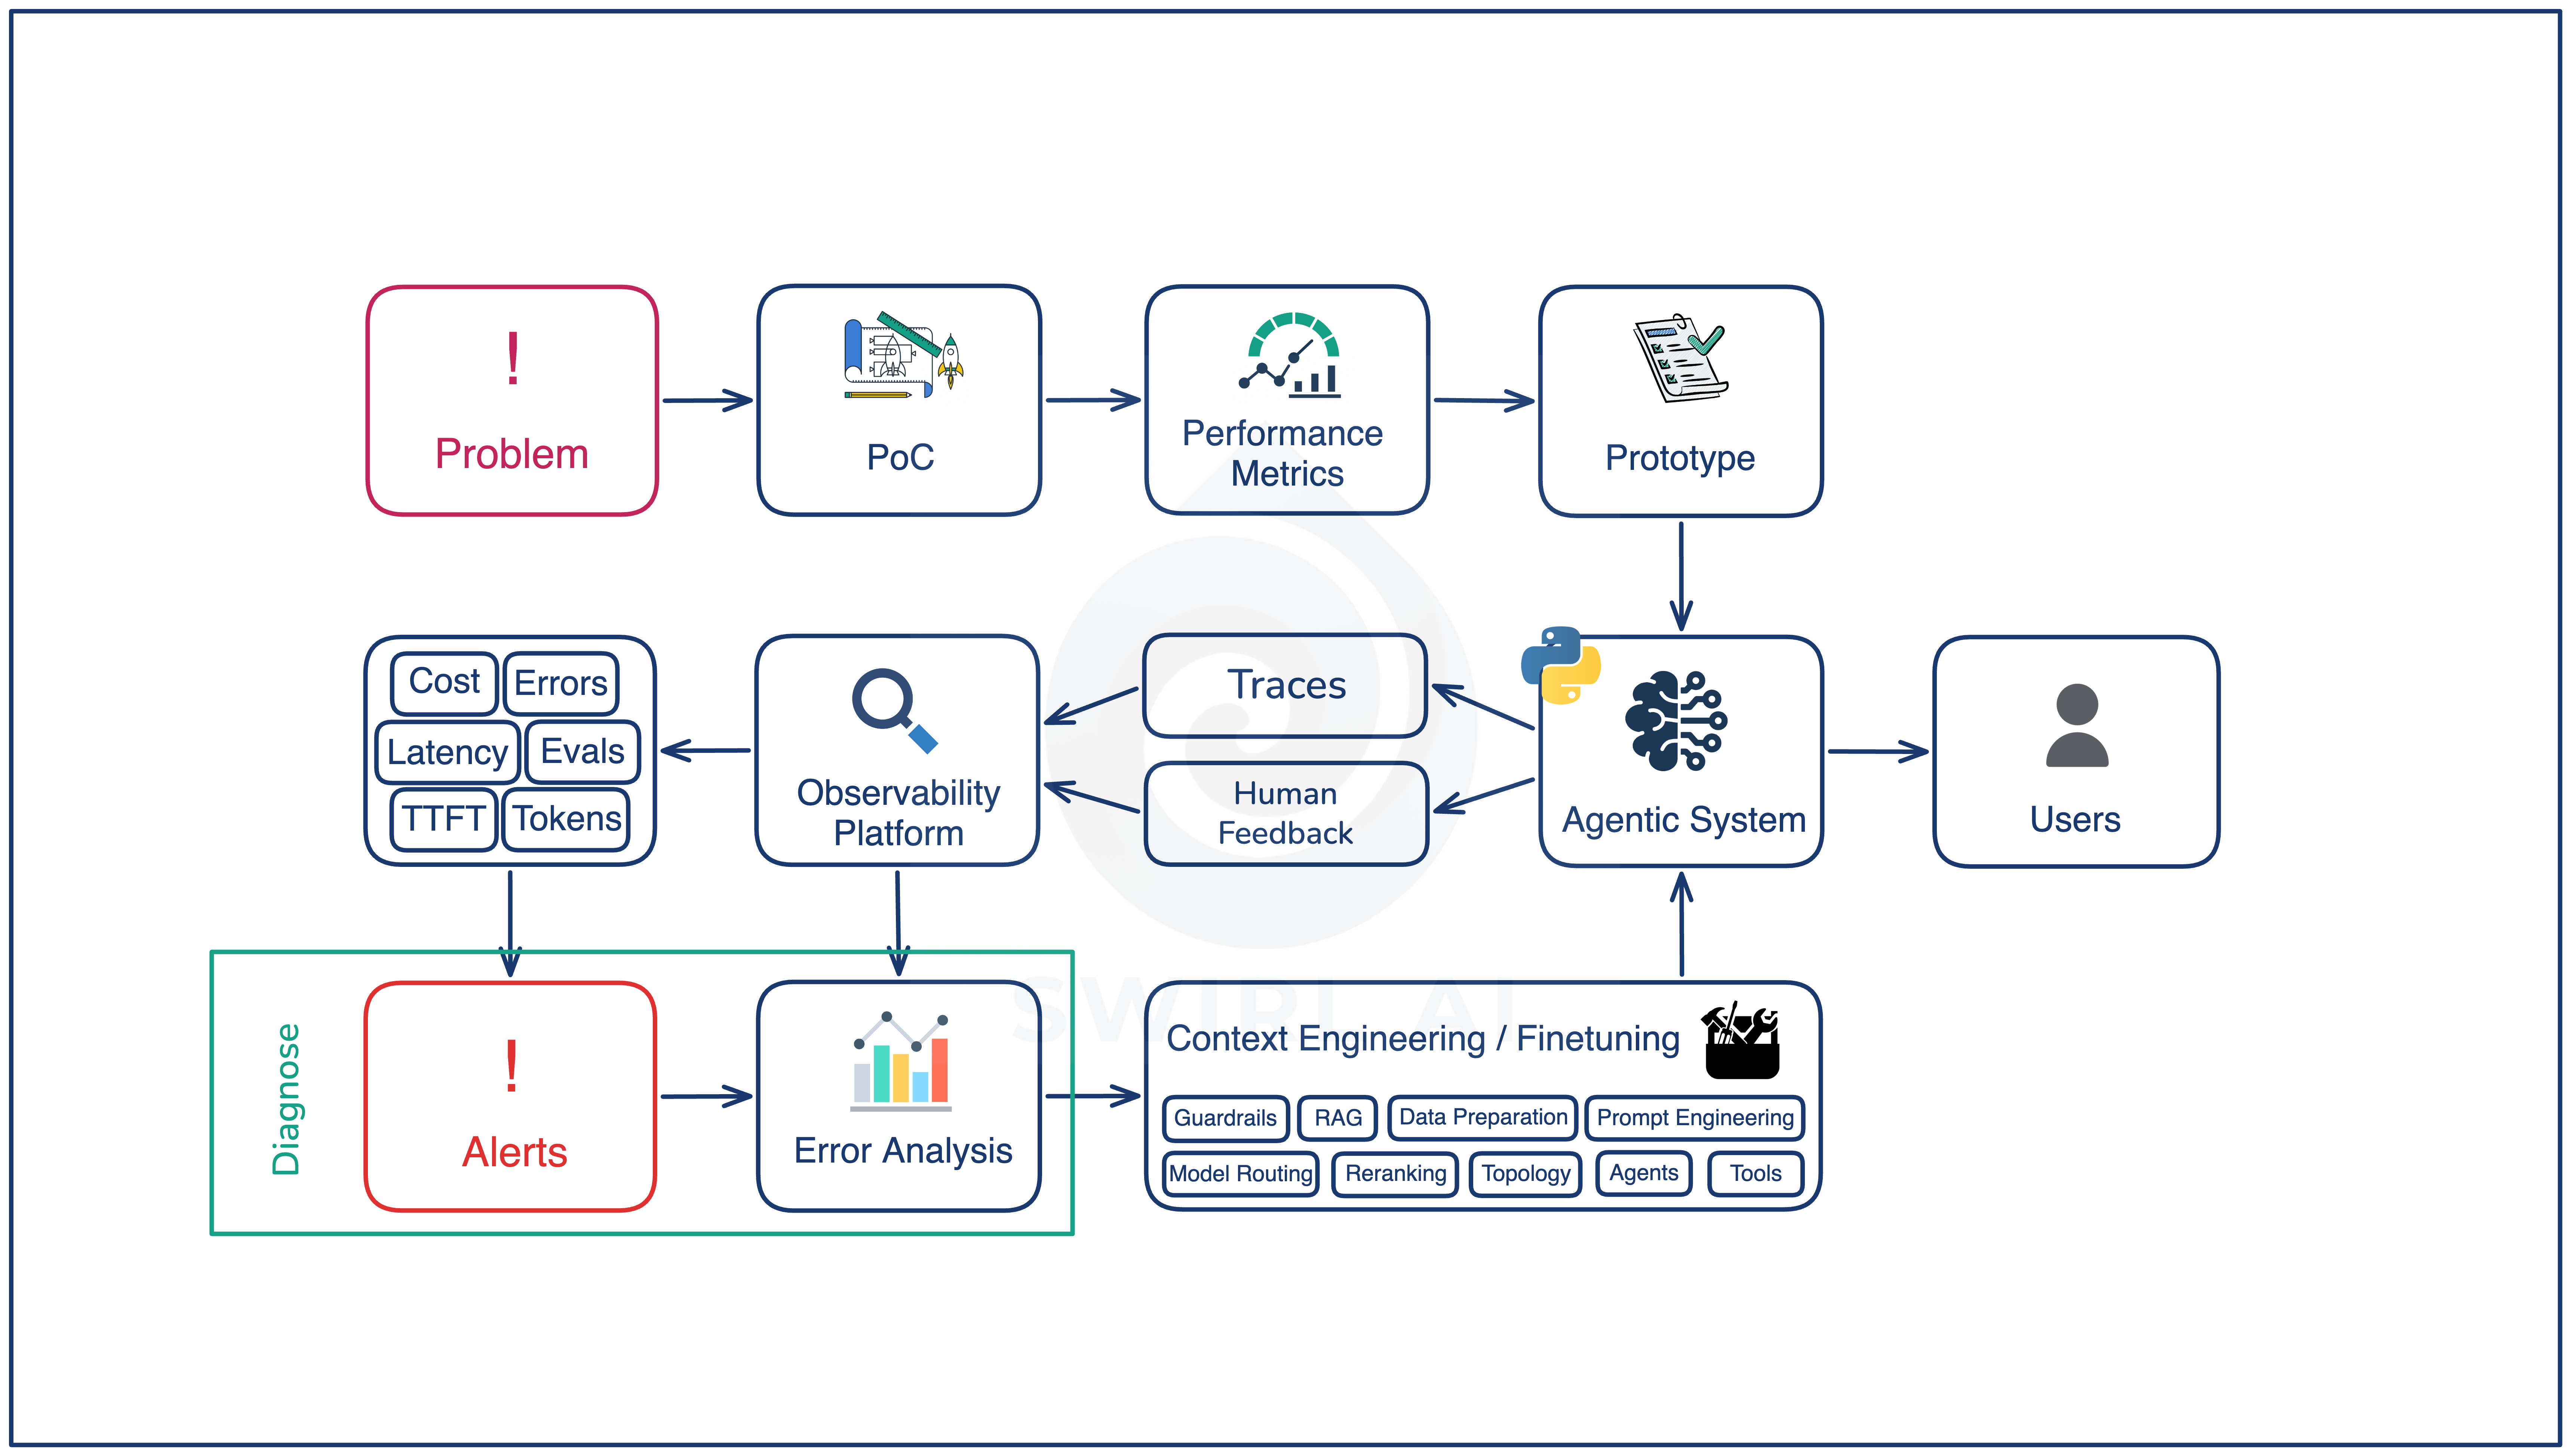
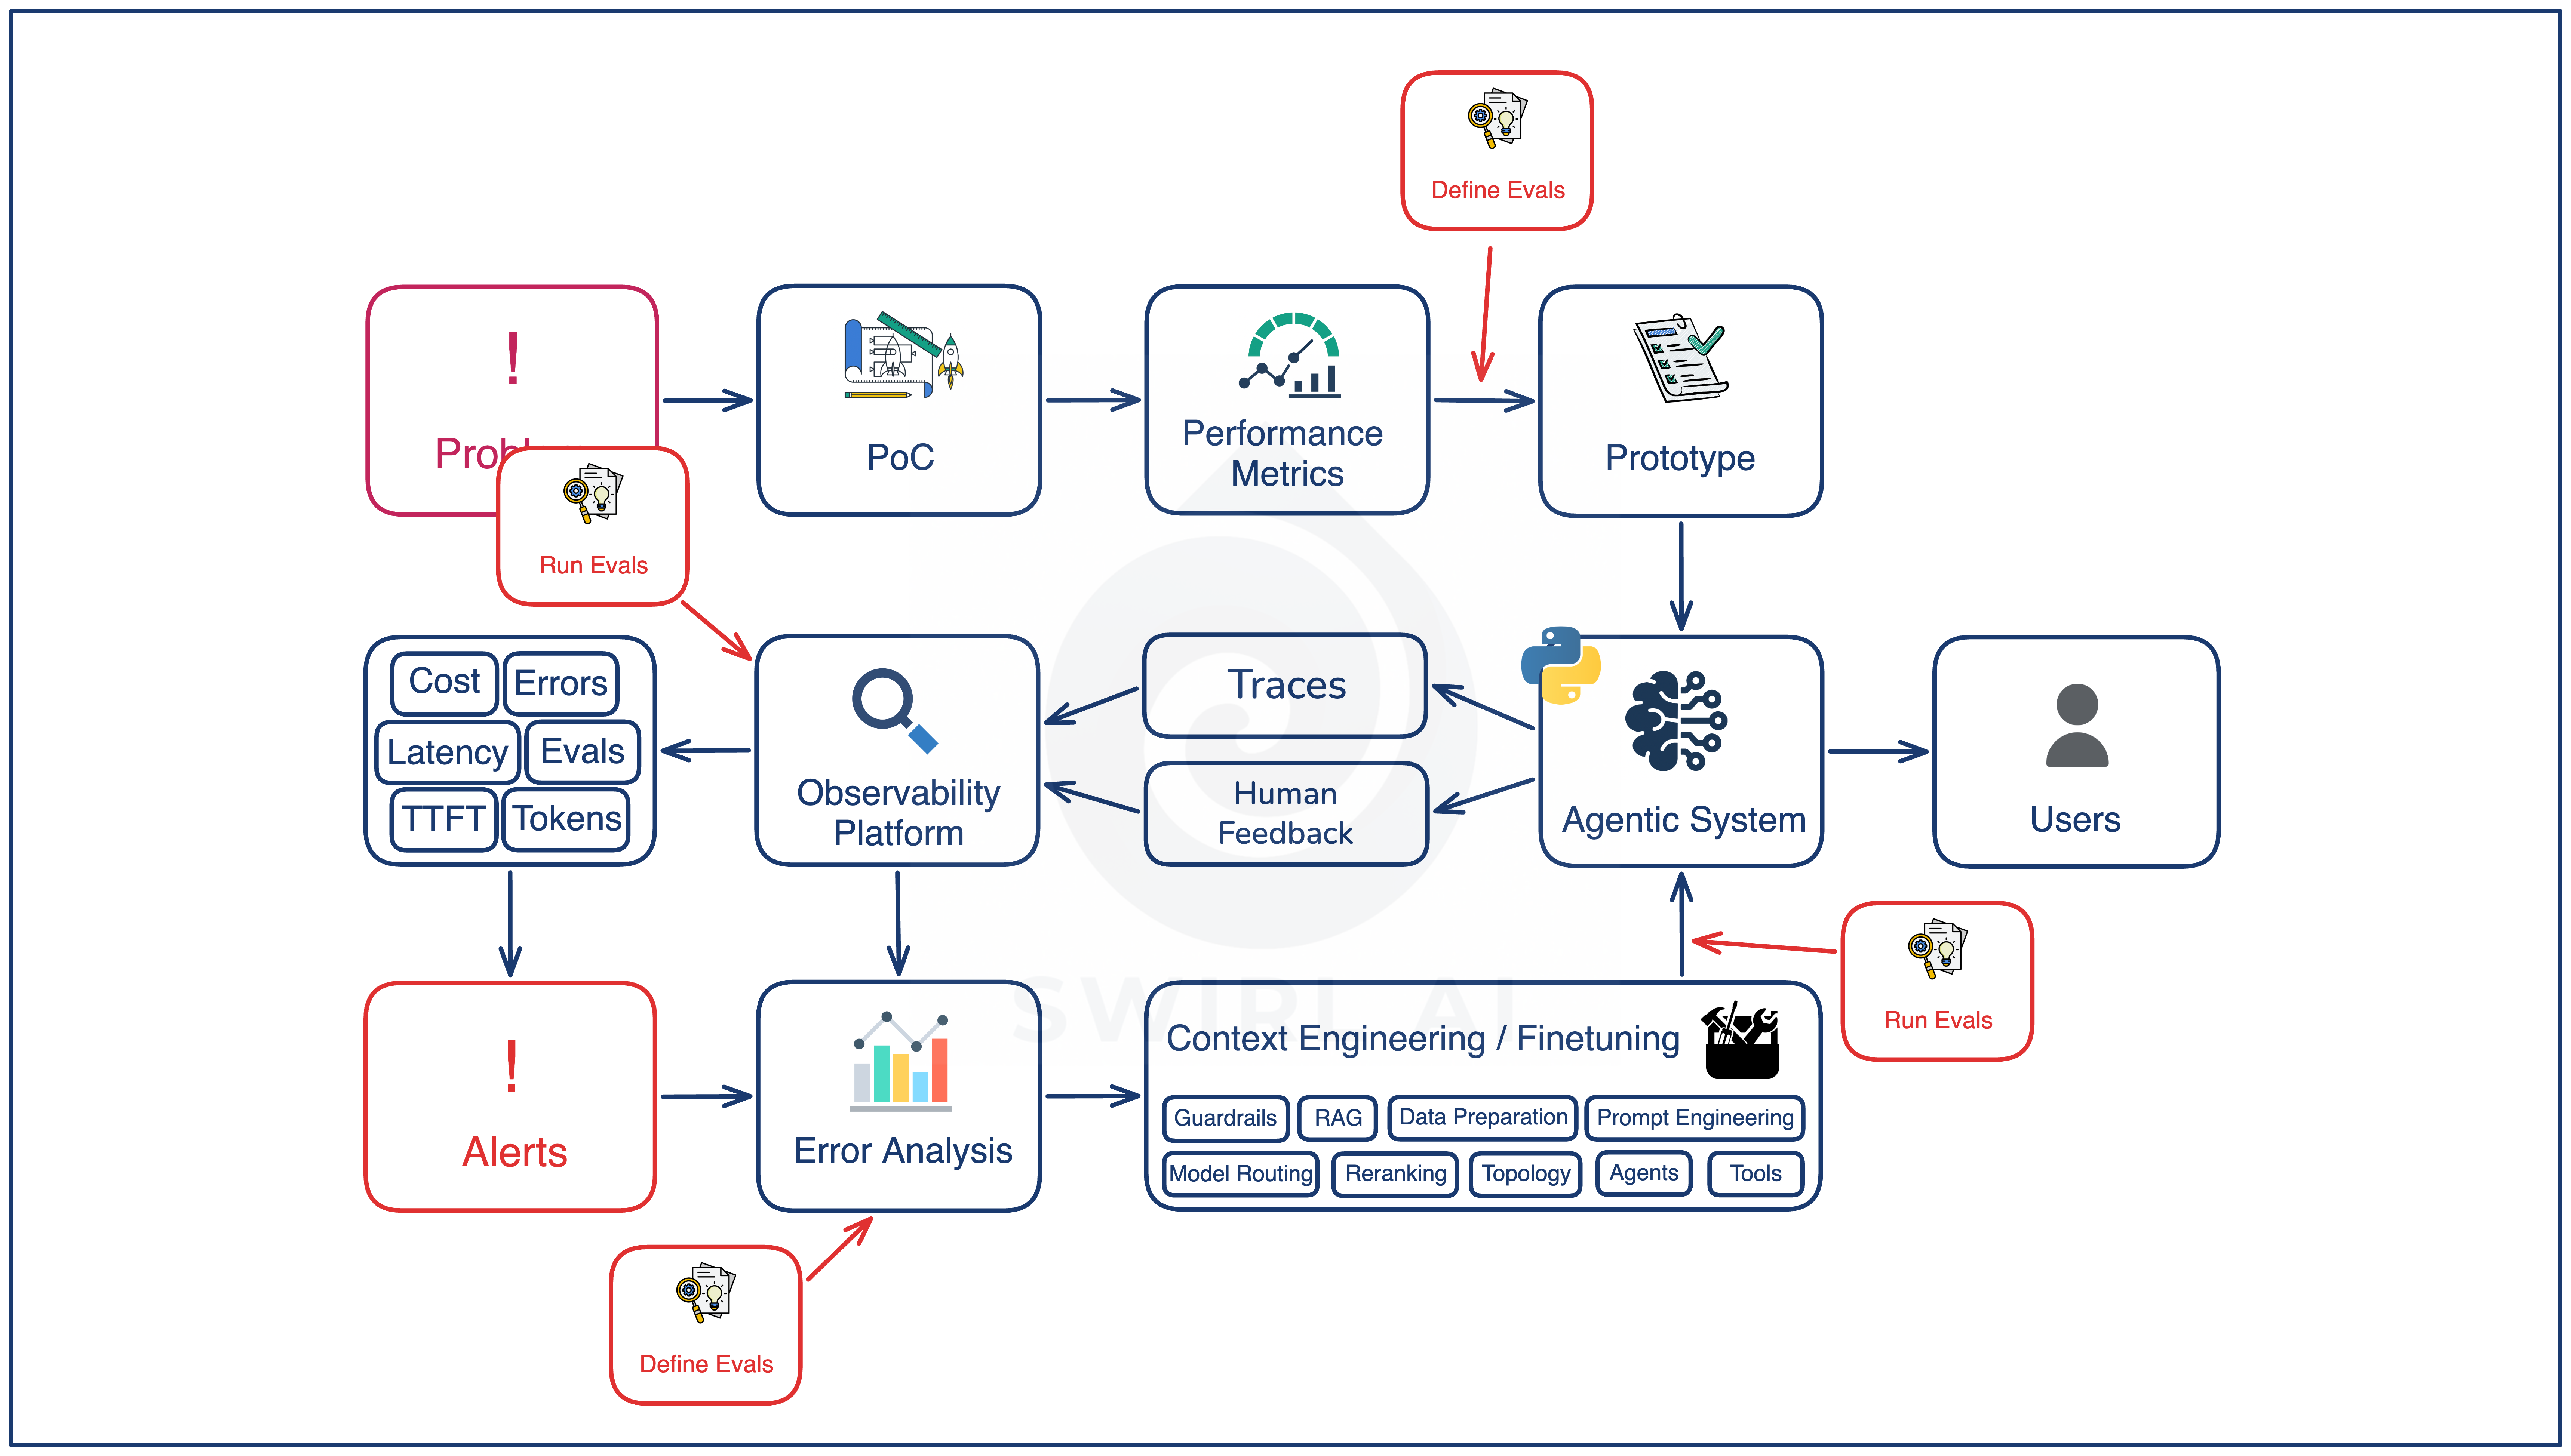
There are two halves to the lifecycle of an agentic system.
The first half is pre-production. Problem definition, proof of concept, performance metrics, and a prototype with an initial eval set. This phase happens once. Its job is to get a working system in front of users without obvious failures.
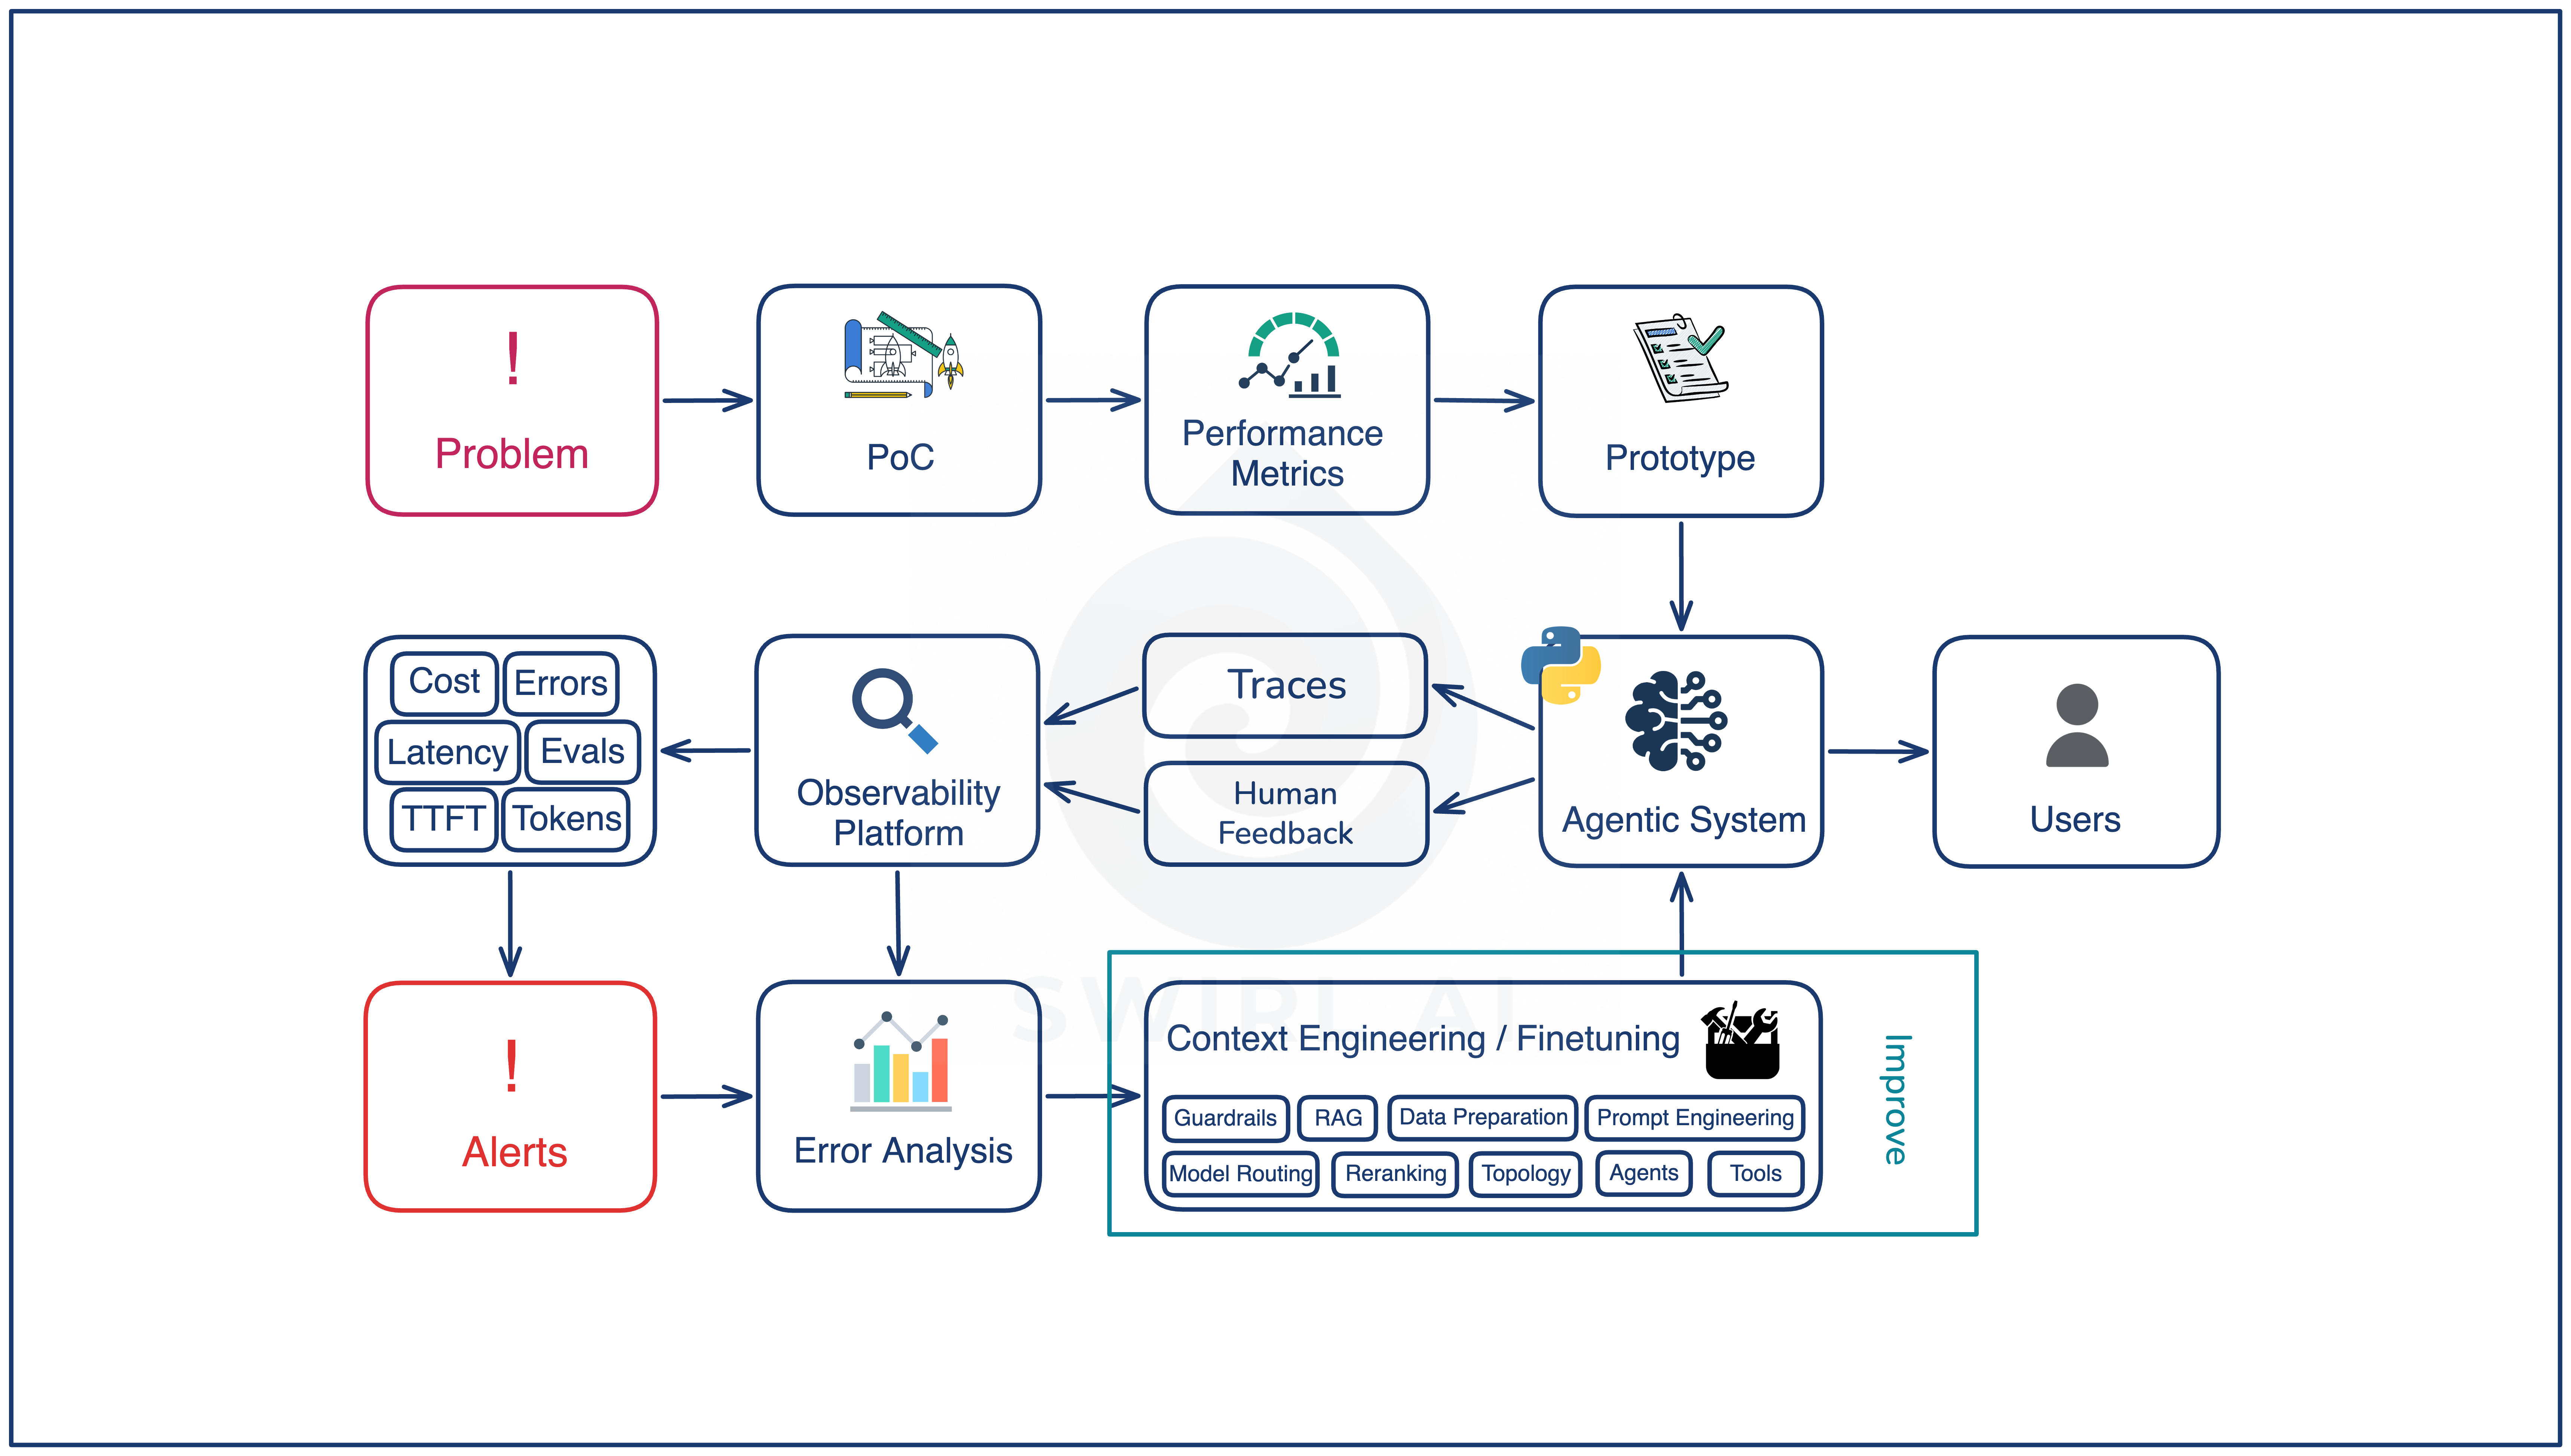
The second half is the recurring loop (Agentic AI Flywheel) that runs after the first version gets shipped: Ship, Observe, Diagnose, Improve, Ship again. Every turn of this loop processes some production traffic, surfaces new failure modes, attaches new evals to them, and lands a new version of the system that aims to satisfy most of the evals the team has ever written.
Preproduction gets you onto the loop. The loop is where the system improves over time.
Pre-production: getting onto the loop
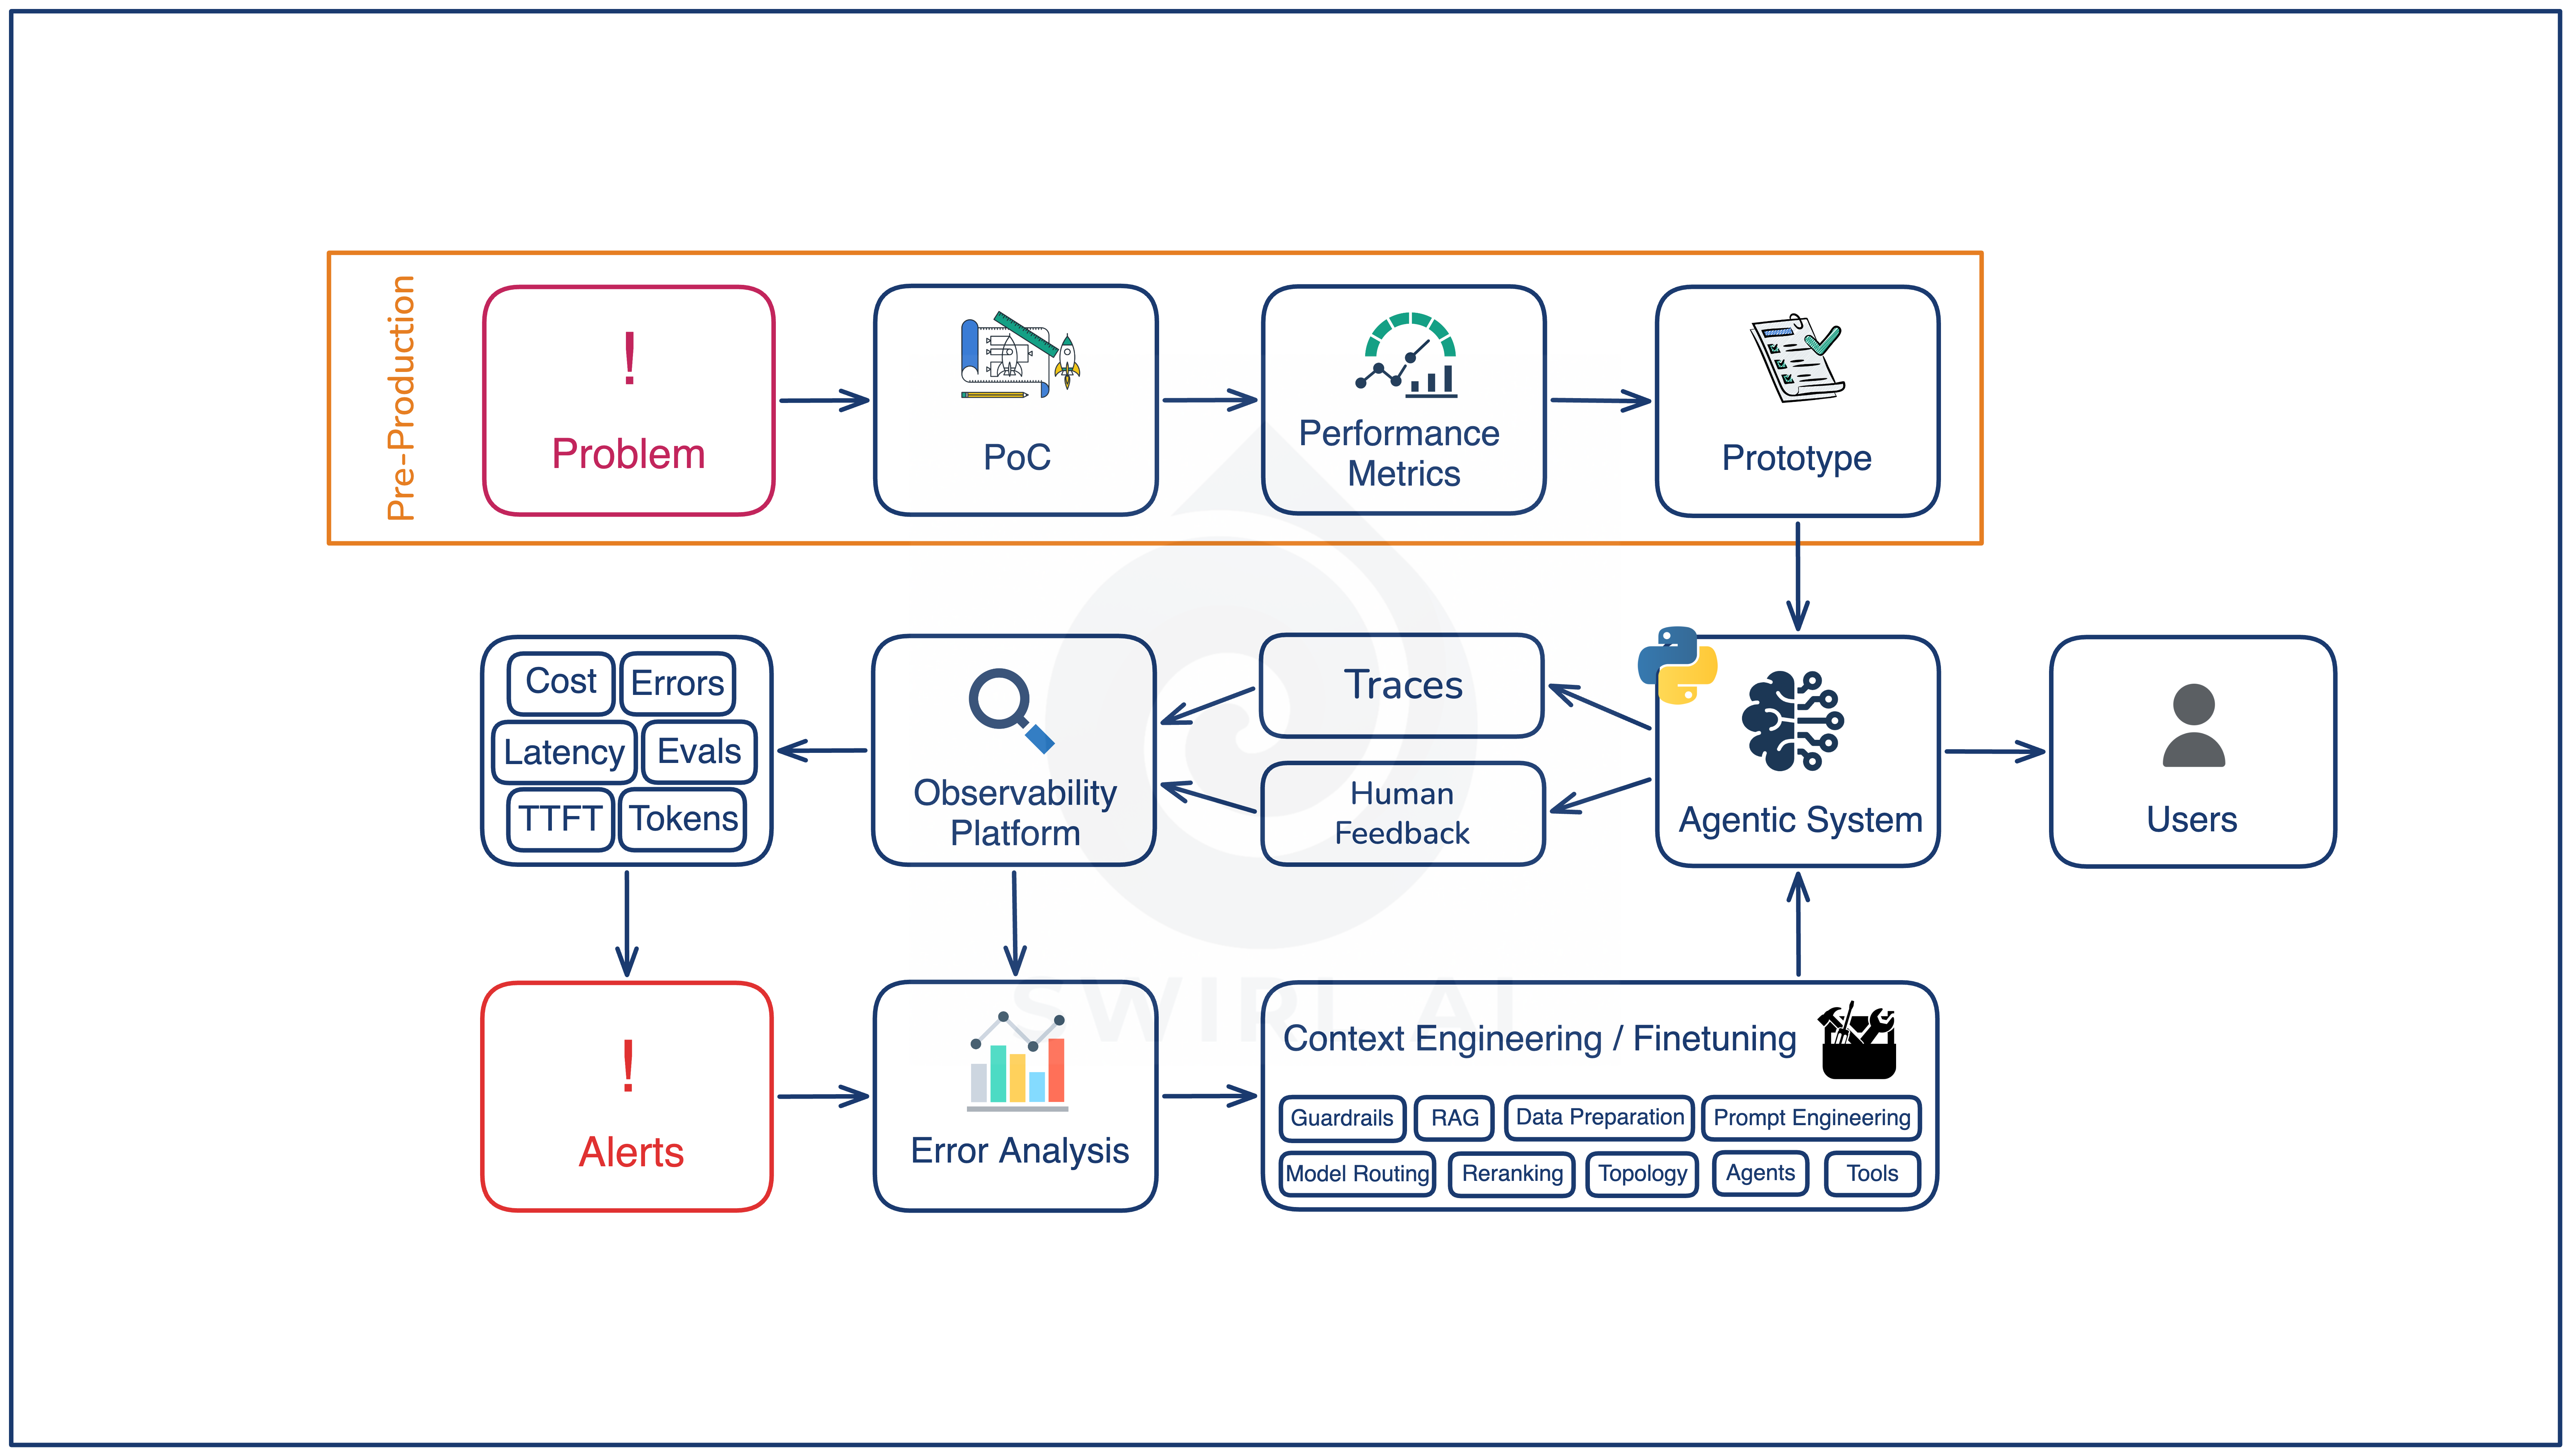
Preproduction has four stages.
Problem. Defining what the agent does and what counts as a correct outcome. For a support automation agent, this is the policy on which tickets it handles, which it escalates, and which behaviors are considered failures regardless of correctness (off-brand tone, ungrounded citations, missing required fields). A reminder, not all problems are a good fit for LLMs to solve.
Proof of concept. A throwaway implementation that confirms the model and the tool surface can do the task in the first place. This is not the production system. It exists to reduce risk: if a basic prompted-LLM-plus-tools setup cannot get to a usable answer in a few iterations for a small subset of the problem, you might have hard time context engineering the system to work as expected.
You can learn more about the current state of the context engineering in my previous article:

Performance metrics. Decided before the prototype, not after. These are the qualities the system will be measured on continuously, more specifically - business metrics, e.g. average time to ticket resolution for a customer support bot. These are not LLM system eval metrics.
Prototype with an initial eval set. This is the system you ship. The eval set comes from two sources, both of which exist before production traffic does:
Synthetic data generation for inputs you can imagine. Edge cases, adversarial prompts, format variations. Useful when no production data exists yet.
Historical human work for tasks you are automating from a known ground truth. If a support agent is replacing a human team, the team’s existing answered tickets are your eval set on day one.
One could say that you should ship the first prototype without evals to kick off the flywheel as soon as possible. In real world you don’t want to release something that might obviously damage the user trust with weirdly incorrect outputs. That is why you have these initial eval sets.
Ship
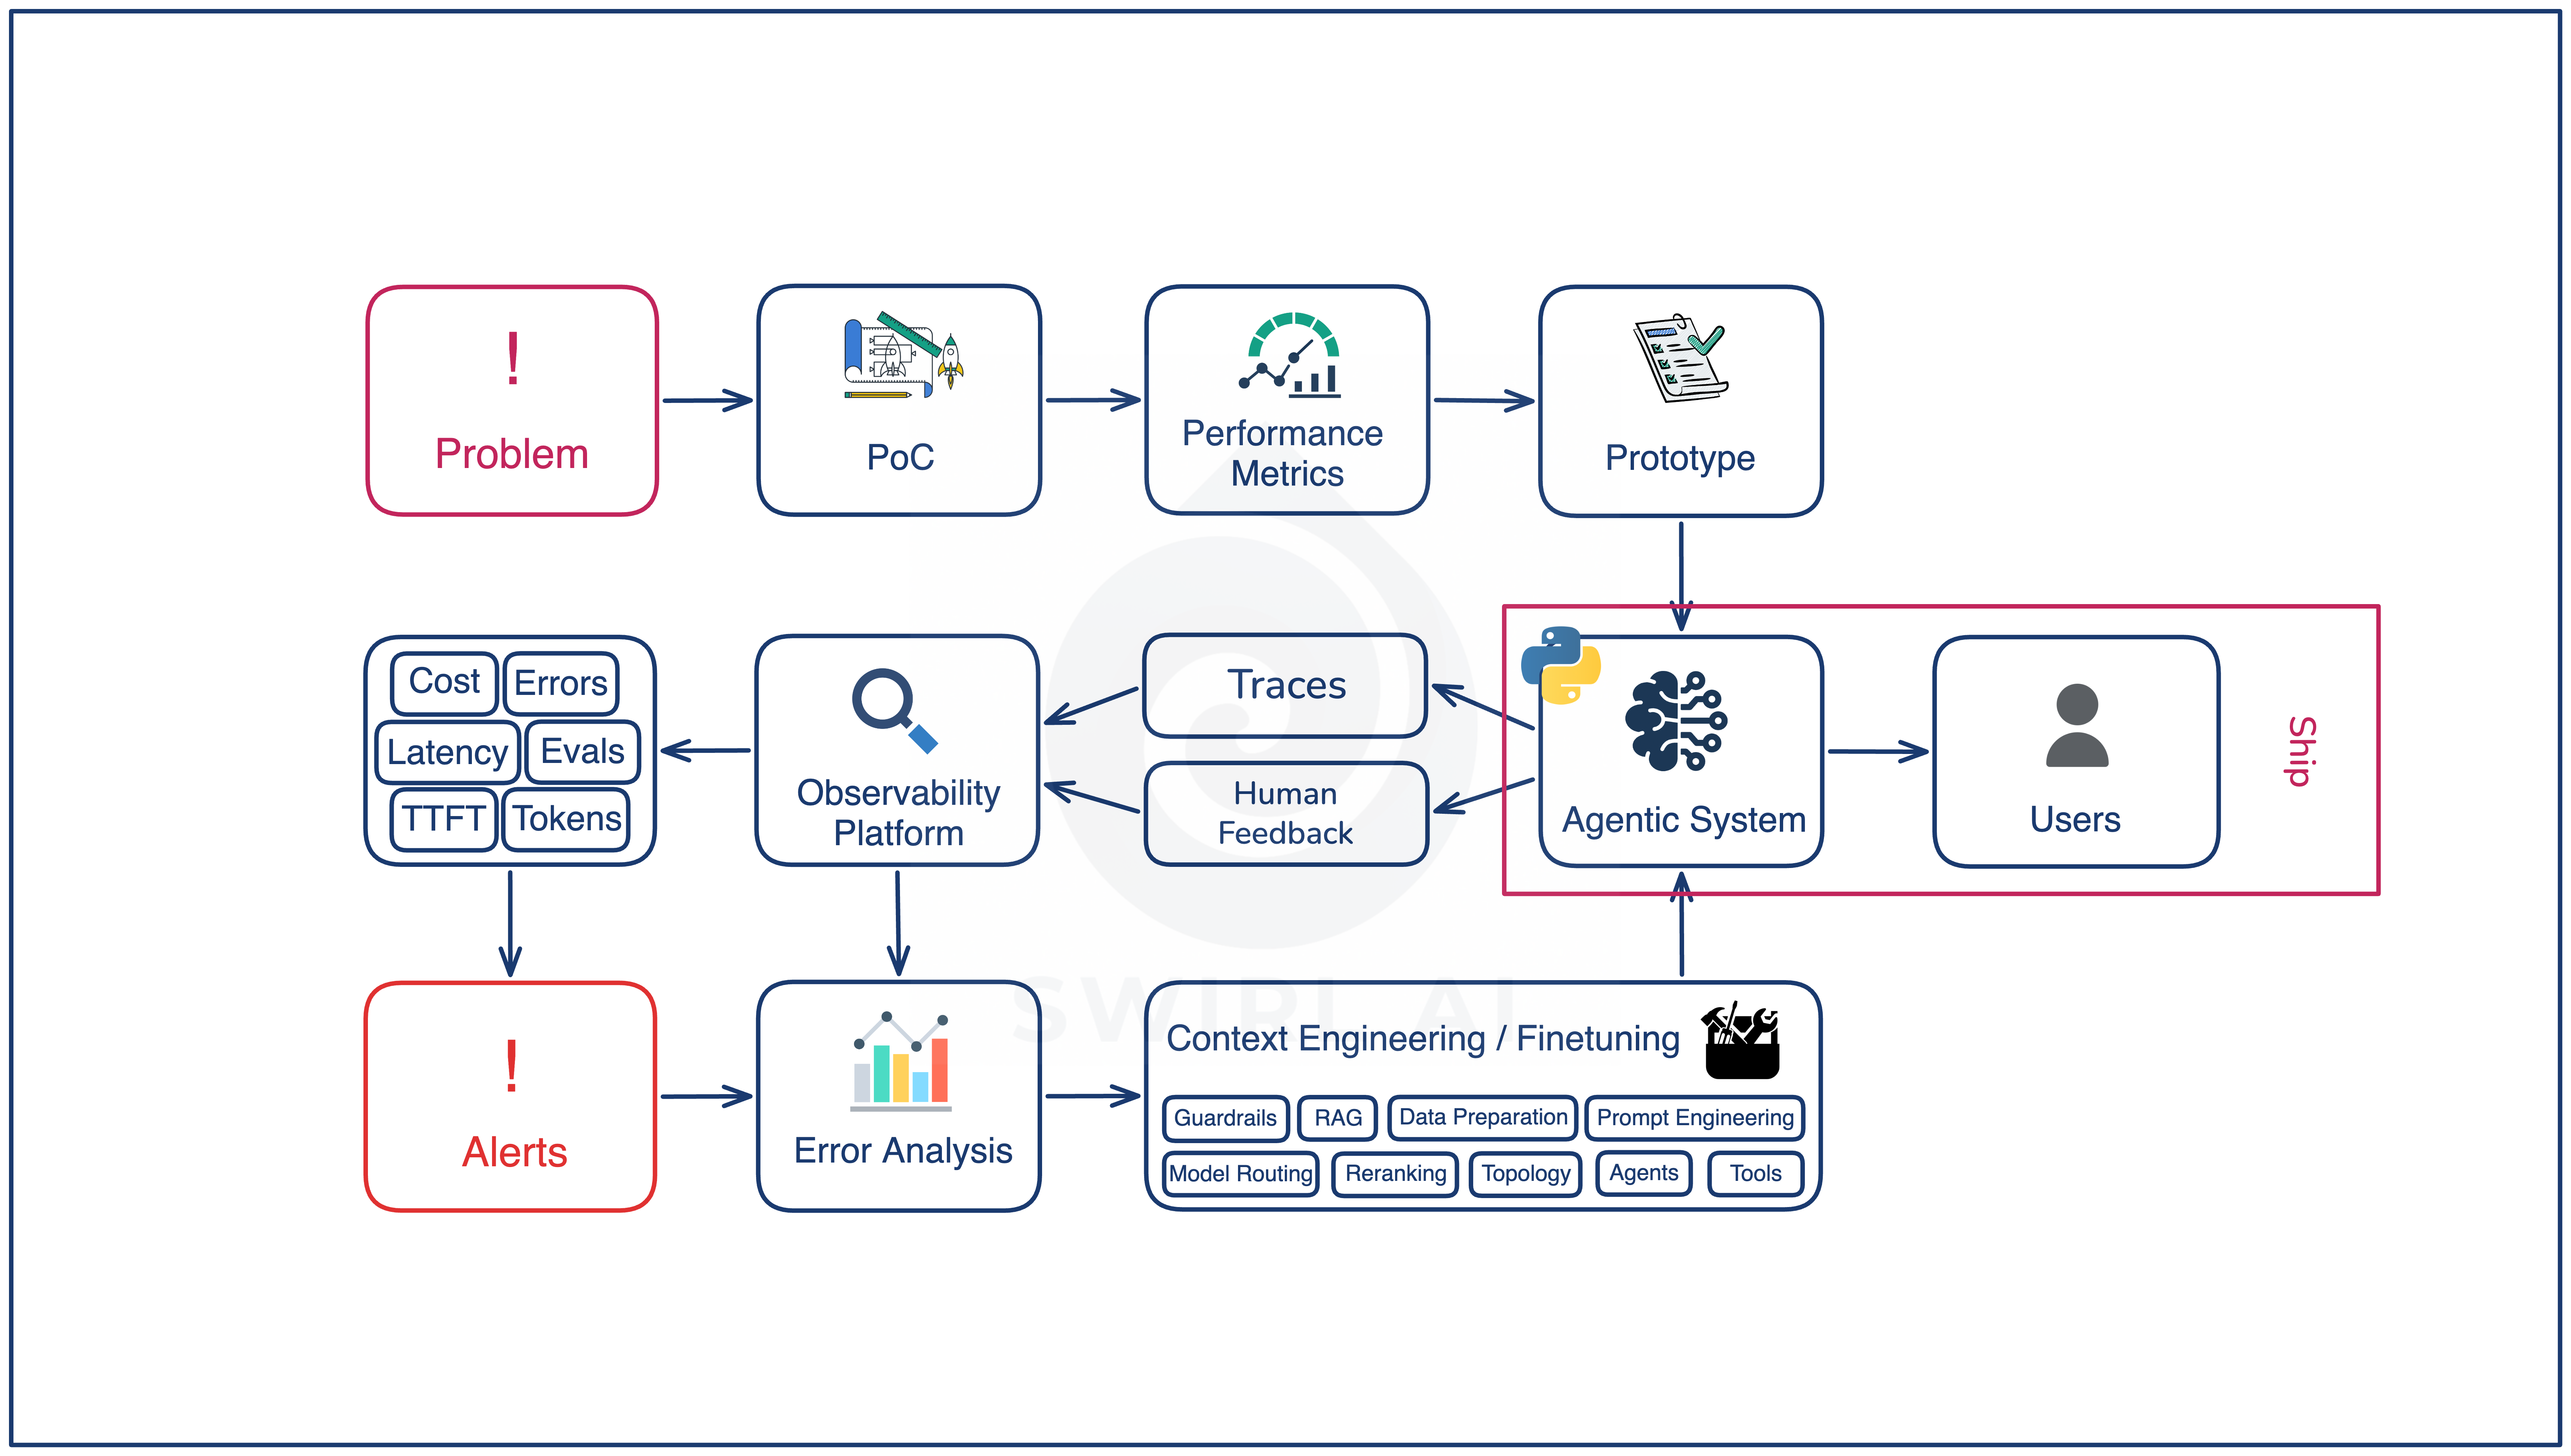
The agentic system runs in production with real users. The artifact at this stage is the system itself: prompts, tool surface, retrieval pipeline, model choice, guardrails. Everything that runs when a request comes in.
Two things become true the moment the system is in front of users that were not true before:
You start collecting traces and feedback, which is the raw information the rest of the loop relies on.
System drift becomes inevitable. Whatever the world looks like the day you shipped the system is not what it will look like in six weeks.
The first Ship is the riskiest one because the loop has not started turning yet. There is no diagnosis cycle, no error-mode catalog, and no second version of the system to compare to. The mitigation is the initial eval set from preproduction, plus how quickly you can move to the next stage.
Observe
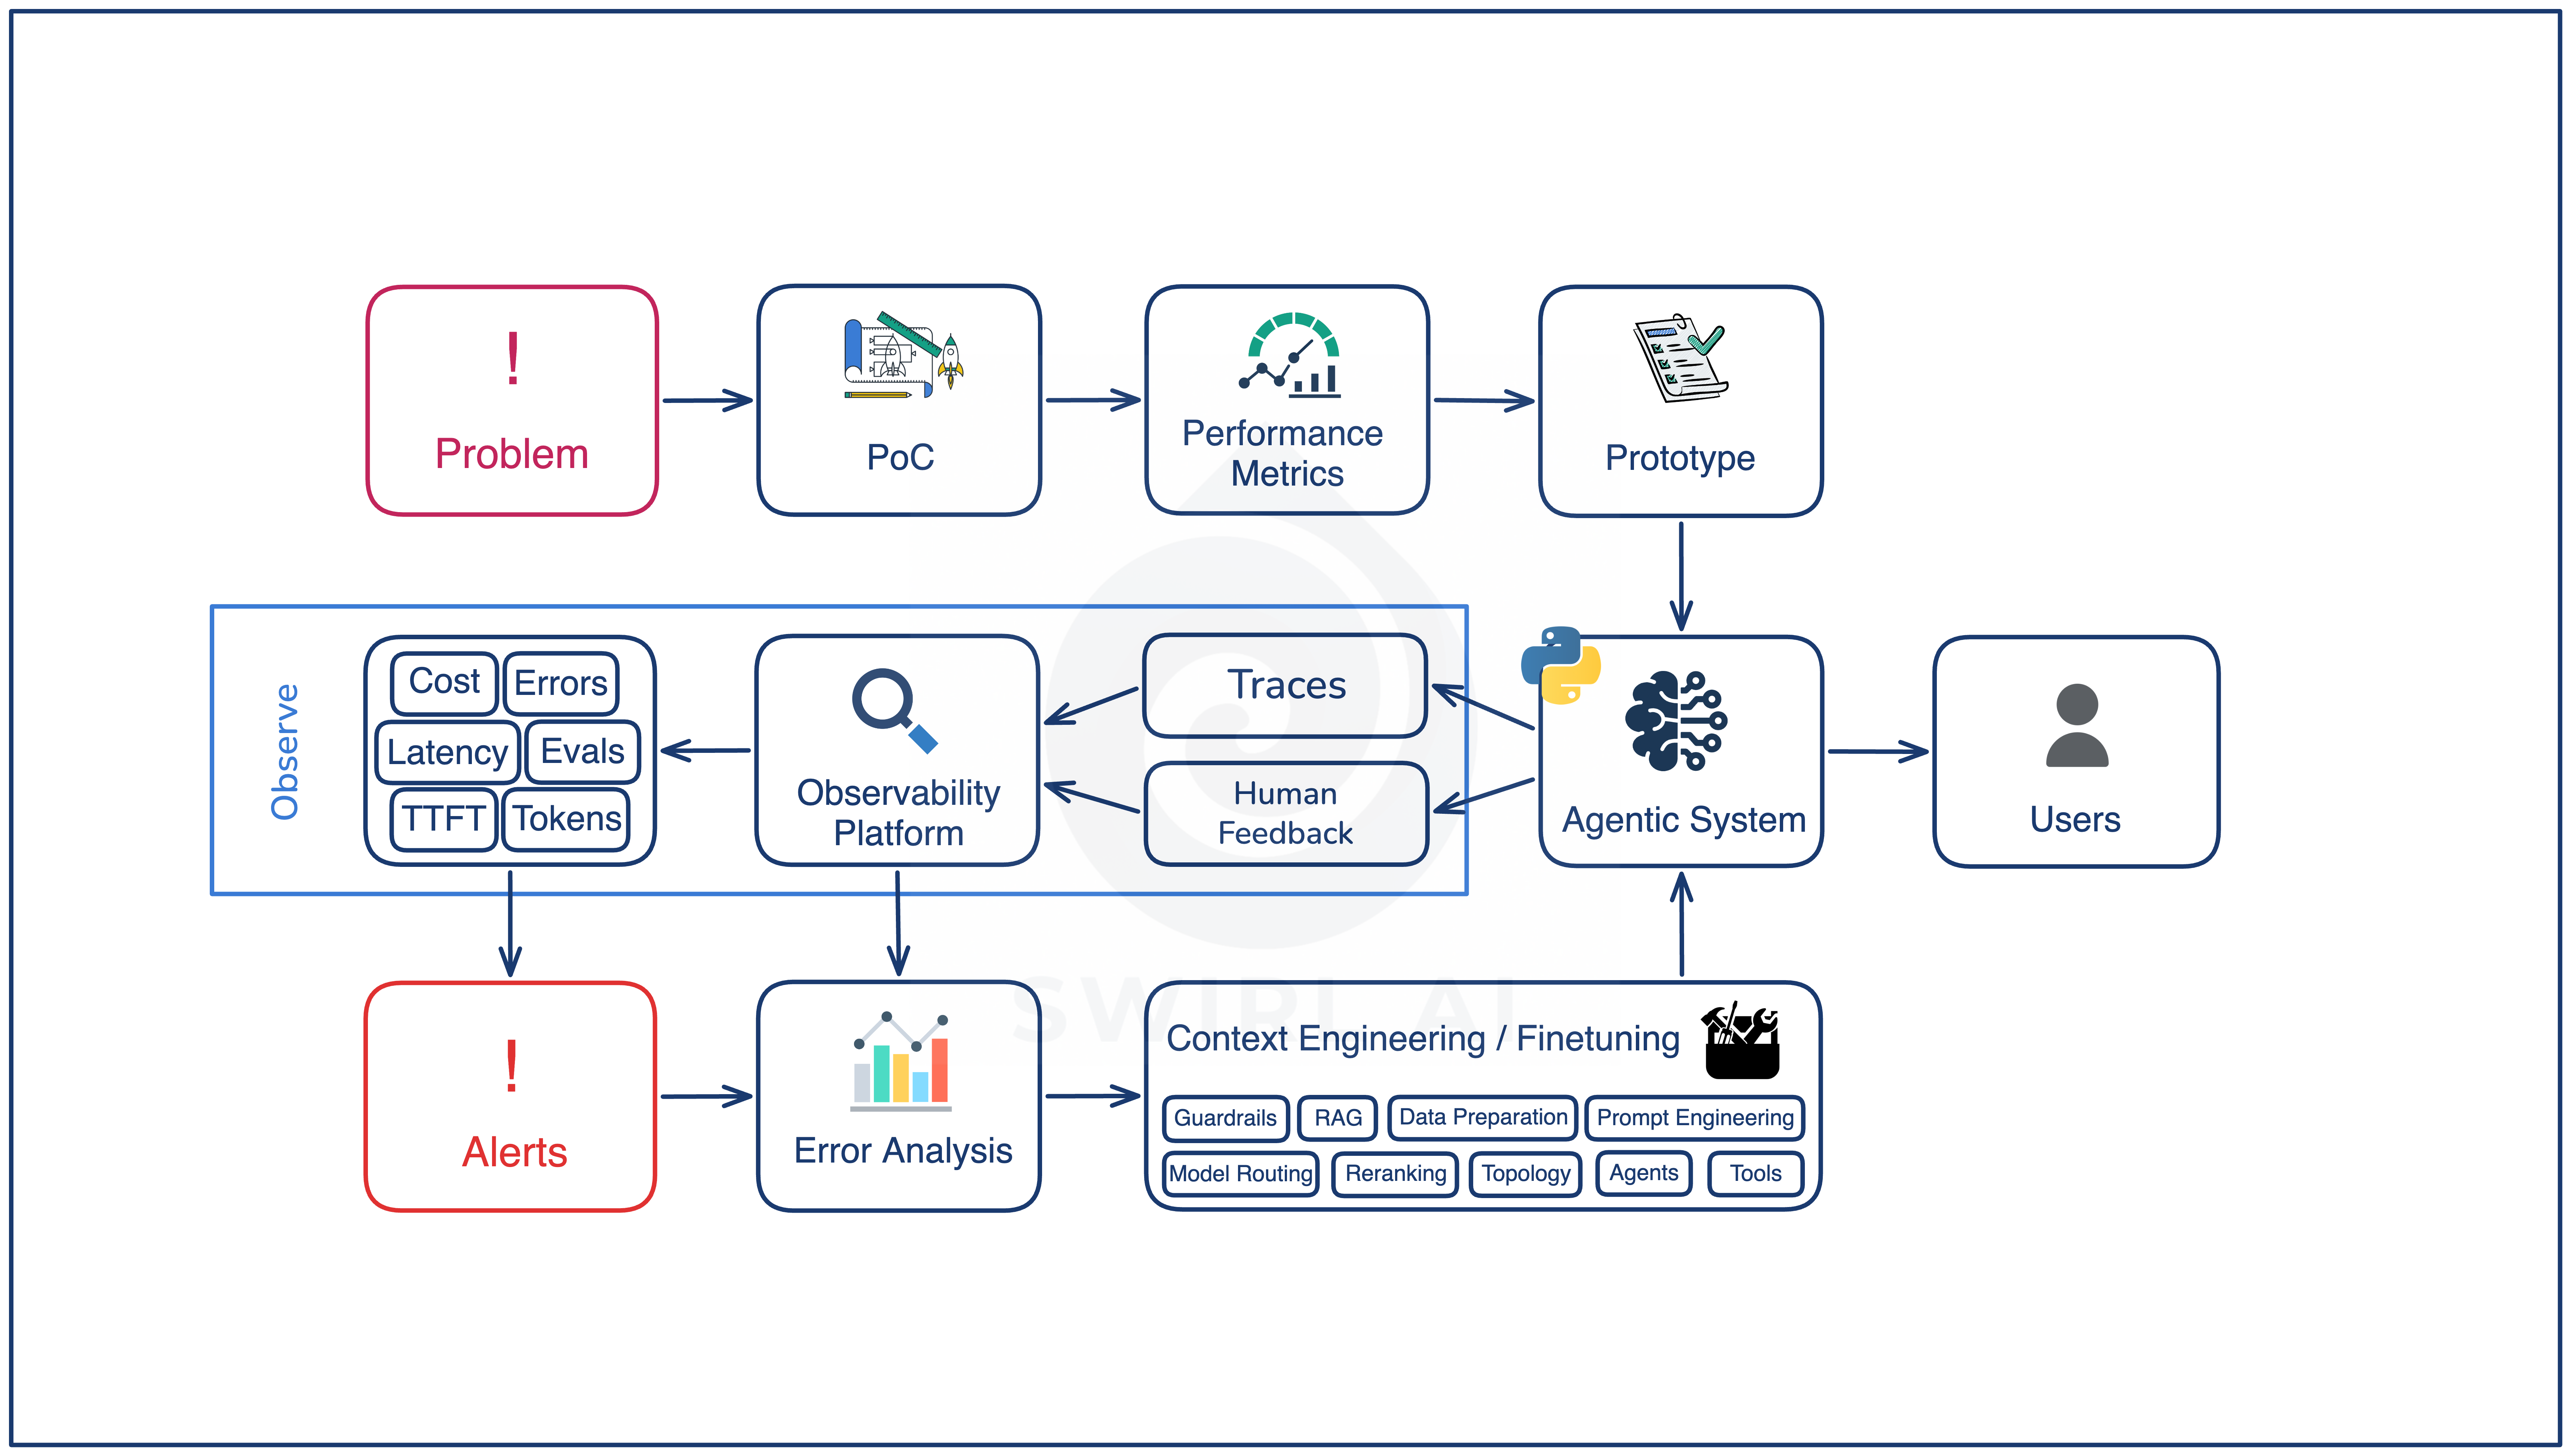
Every invocation produces a span-level trace of LLM calls, tool calls, and intermediate outputs. Every user interaction can produce a thumbs up, a thumbs down, or a more structured feedback signal. The artifact at this stage is the observability platform: where traces, feedback, and the metrics derived from them all land.
Two practical notes that affect how teams actually adopt this stage.
First, alerts are not a gate for the next stage. Error analysis can run on traces and feedback continuously, day one, with no alerting in place. Alerts exist for the failure shapes that continuous review will miss as the system scales, and to catch drift faster than a human reviewer. Some teams put alerting infrastructure on the critical path for the loop and end up not running the loop for months. Run the loop with what you already have, then add alerting when volume demands it.
Second, the same observability platform also runs evals as a monitor on sampled production traffic. This is the continuous side of the eval set, separate from CI/CD gates. Decay in eval scores on the monitor is a drift signal that arrives before any user complaint does.
You can check out the article about observability in Agentic Systems I wrote some time ago that still holds strong here:

Diagnose
Trace and feedback data gets pulled for review purpose, failures get clustered into named error modes, and each error mode becomes a routing signal. The artifact at this stage is the error-mode catalog plus the evals attached to each mode.
For a support automation agent, some named error modes would look like:
Hallucinated citation (the agent cites a knowledge-base article that does not support its claim)
Wrong tool selected (the agent runs
ticket_lookupwhen the user asked for an order status)Missed retrieval (the answer exists in the knowledge base but never made it into the model’s context)
Broken output format (free-text response where a structured object was required)
Off-brand tone (factually correct but reads wrong for the audience)
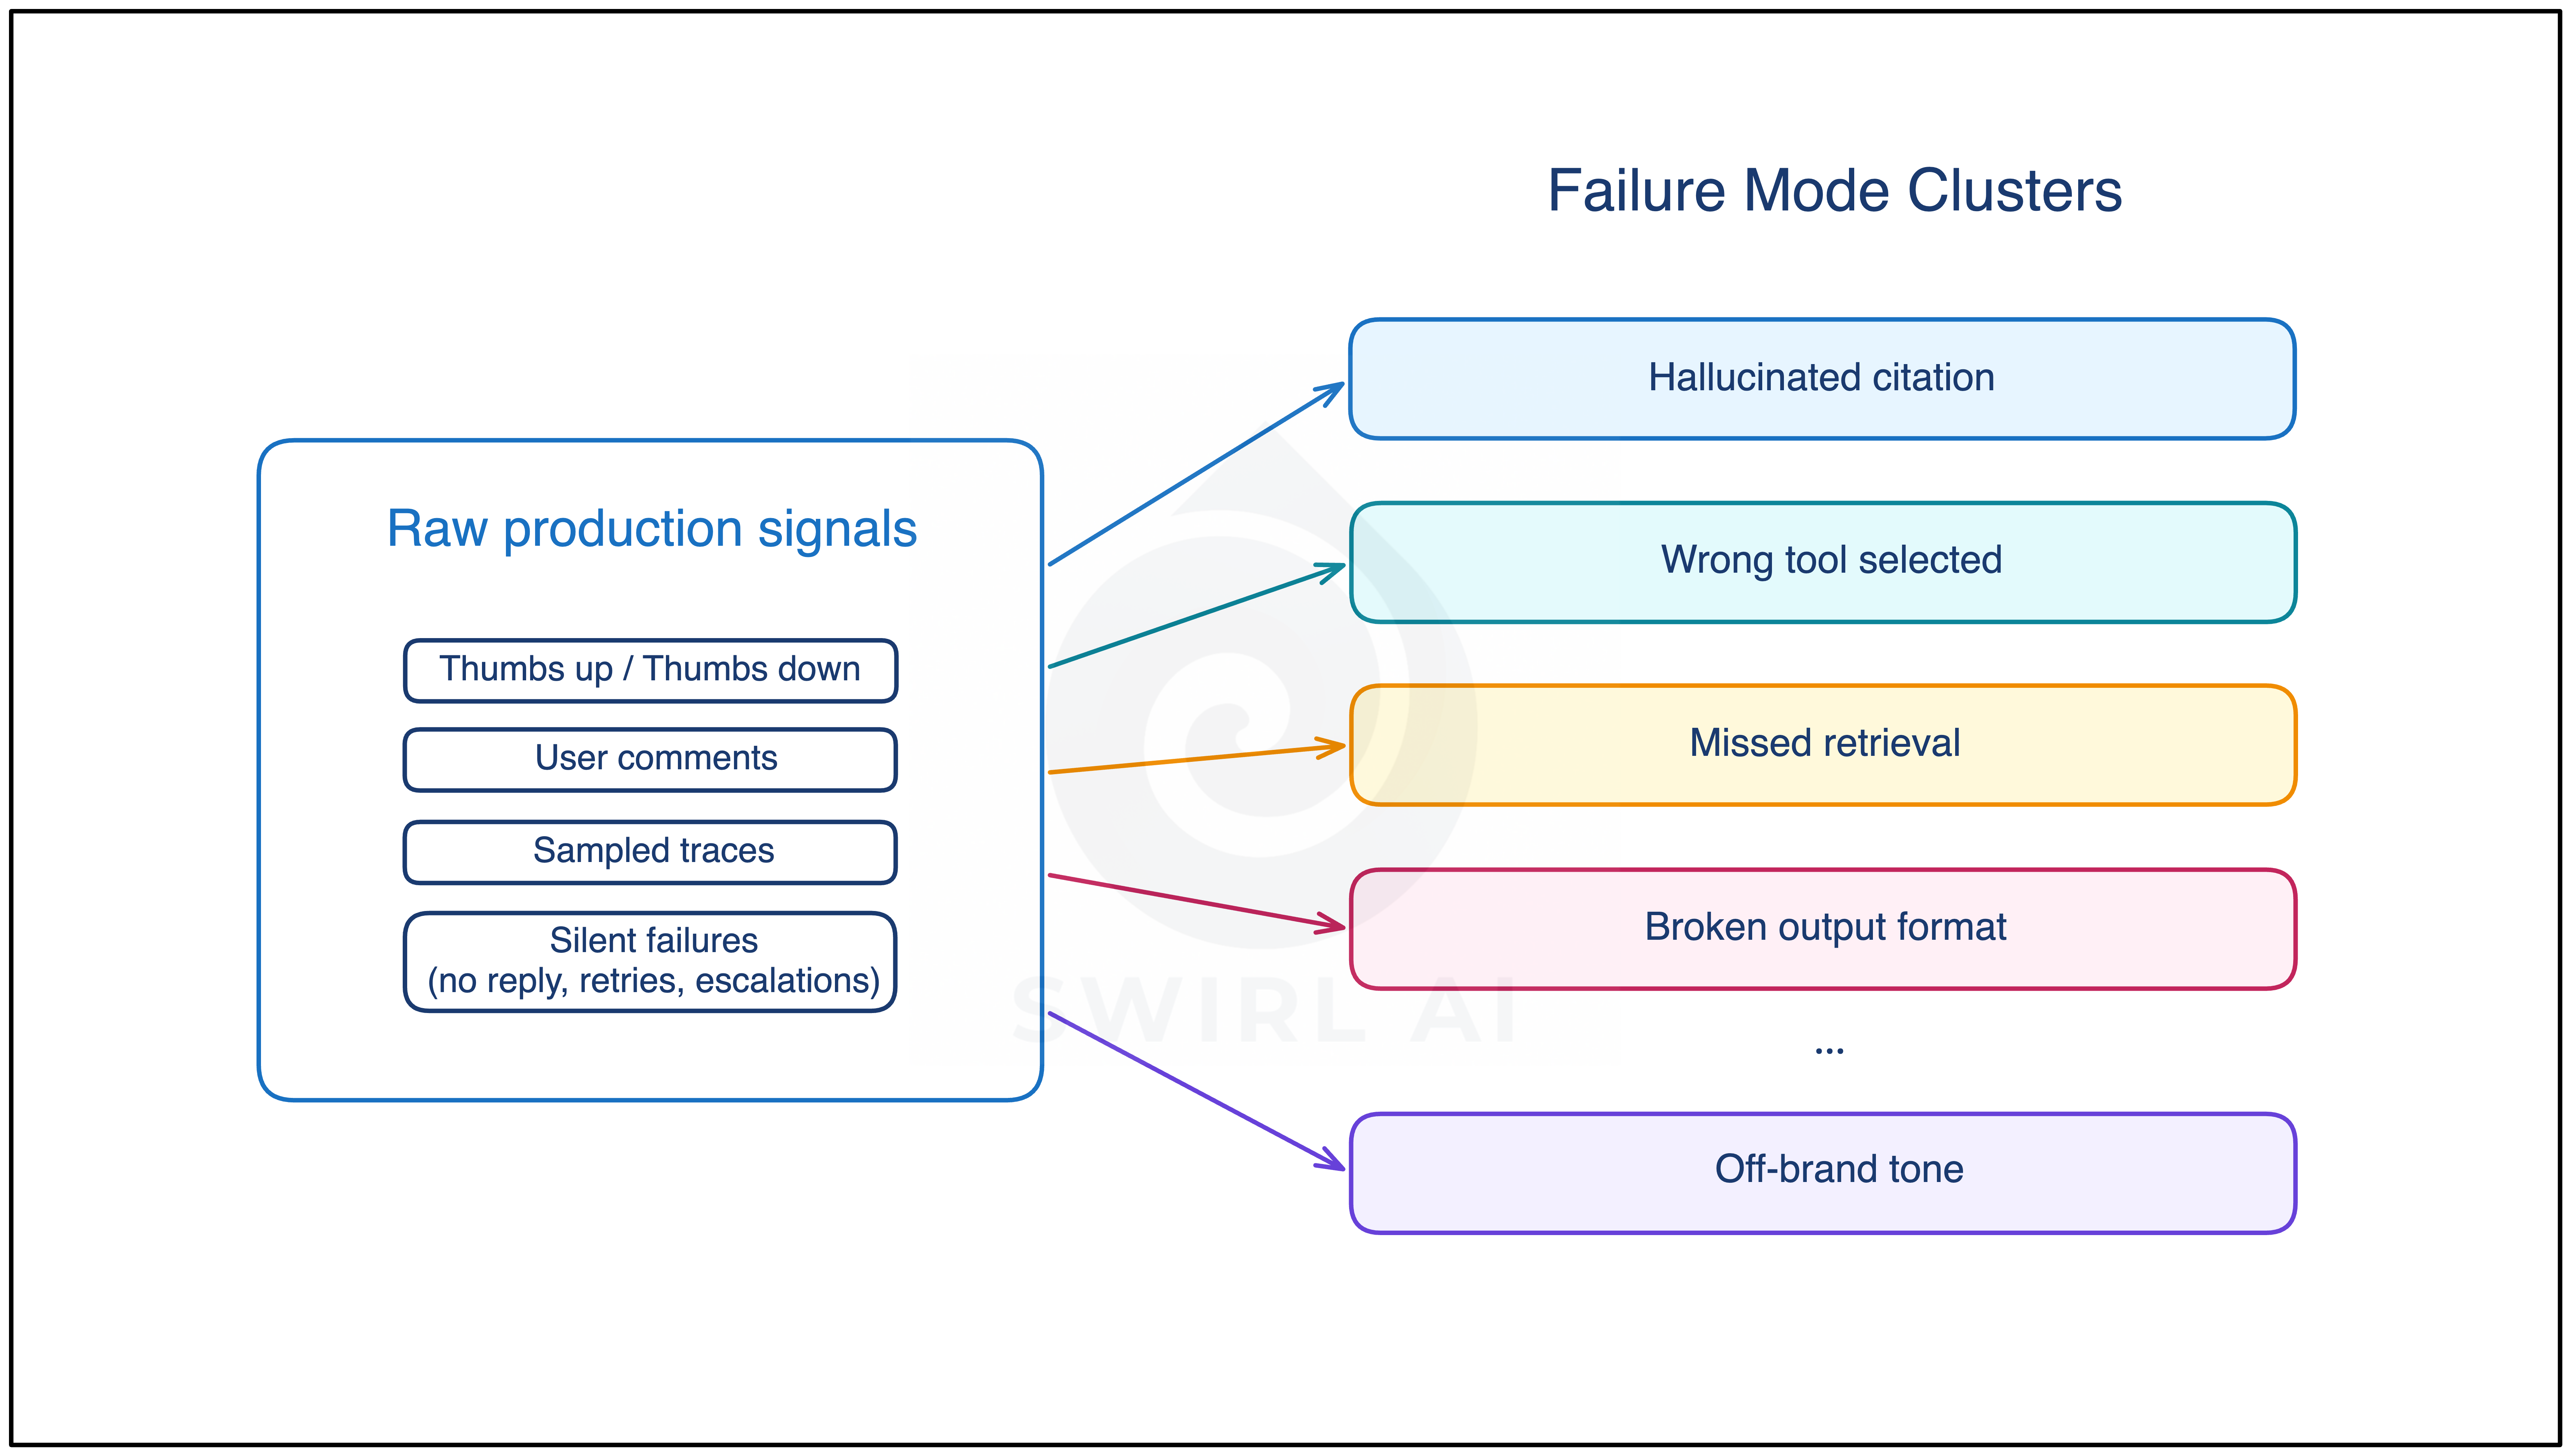
Naming the error modes is the first half of Diagnose. The second half is the discipline of eval driven development and this determinise how fast you can safely iterate on the system.
Learn how to apply all of this in practice in my End-to-end AI Engineering Bootcamp (next cohort starts on June 22nd). Apply code EARLYBIRD15 for 15% off.
Eval-first inside Diagnose
The ordering inside Diagnose that produces compounding returns:
Write the eval the moment you name the error mode. The fix is a separate scheduling decision.
This is the same discipline as test-driven development. You write the failing test first, schedule the fix, and ship the fix when CI says the test passes. The test exists whether or not the fix lands this sprint.
Three things go wrong when the ordering reverses (fix first, eval after):
You have no way to verify that the fix actually fixed the failure shape.
You often never get around to writing the eval, because the fix shipped and the urgency is gone. In some simple cases where the fix is obvious and deterministic it might be fine.
The eval you eventually reverse-engineer describes the shape of the fix, not the shape of the original failure. It passes the moment the fix is in place but does not generalize to similar failures the next quarter.
Eval-first ordering also turns deferred error modes into silent win detectors. A deferred error mode sits in CI as a failing eval. If an unrelated context engineering change later in the quarter accidentally makes it pass, CI tells you in the diff between yesterday’s scores and today’s. Over a year, the deferred-eval pool catches as many accidental improvements as accidental regressions.
The one-line version of the discipline:
Test coverage is not gated by engineering velocity. The eval set grows at the cadence of triage, not the cadence of fixes.
Many teams gate eval growth on the fix being ready and end up writing the eval the week the fix lands, which puts the eval set on the same curve as engineering throughput. Writing the eval at triage time puts the eval set on the curve of error-mode discovery, which is the steeper curve.
What evals actually look like
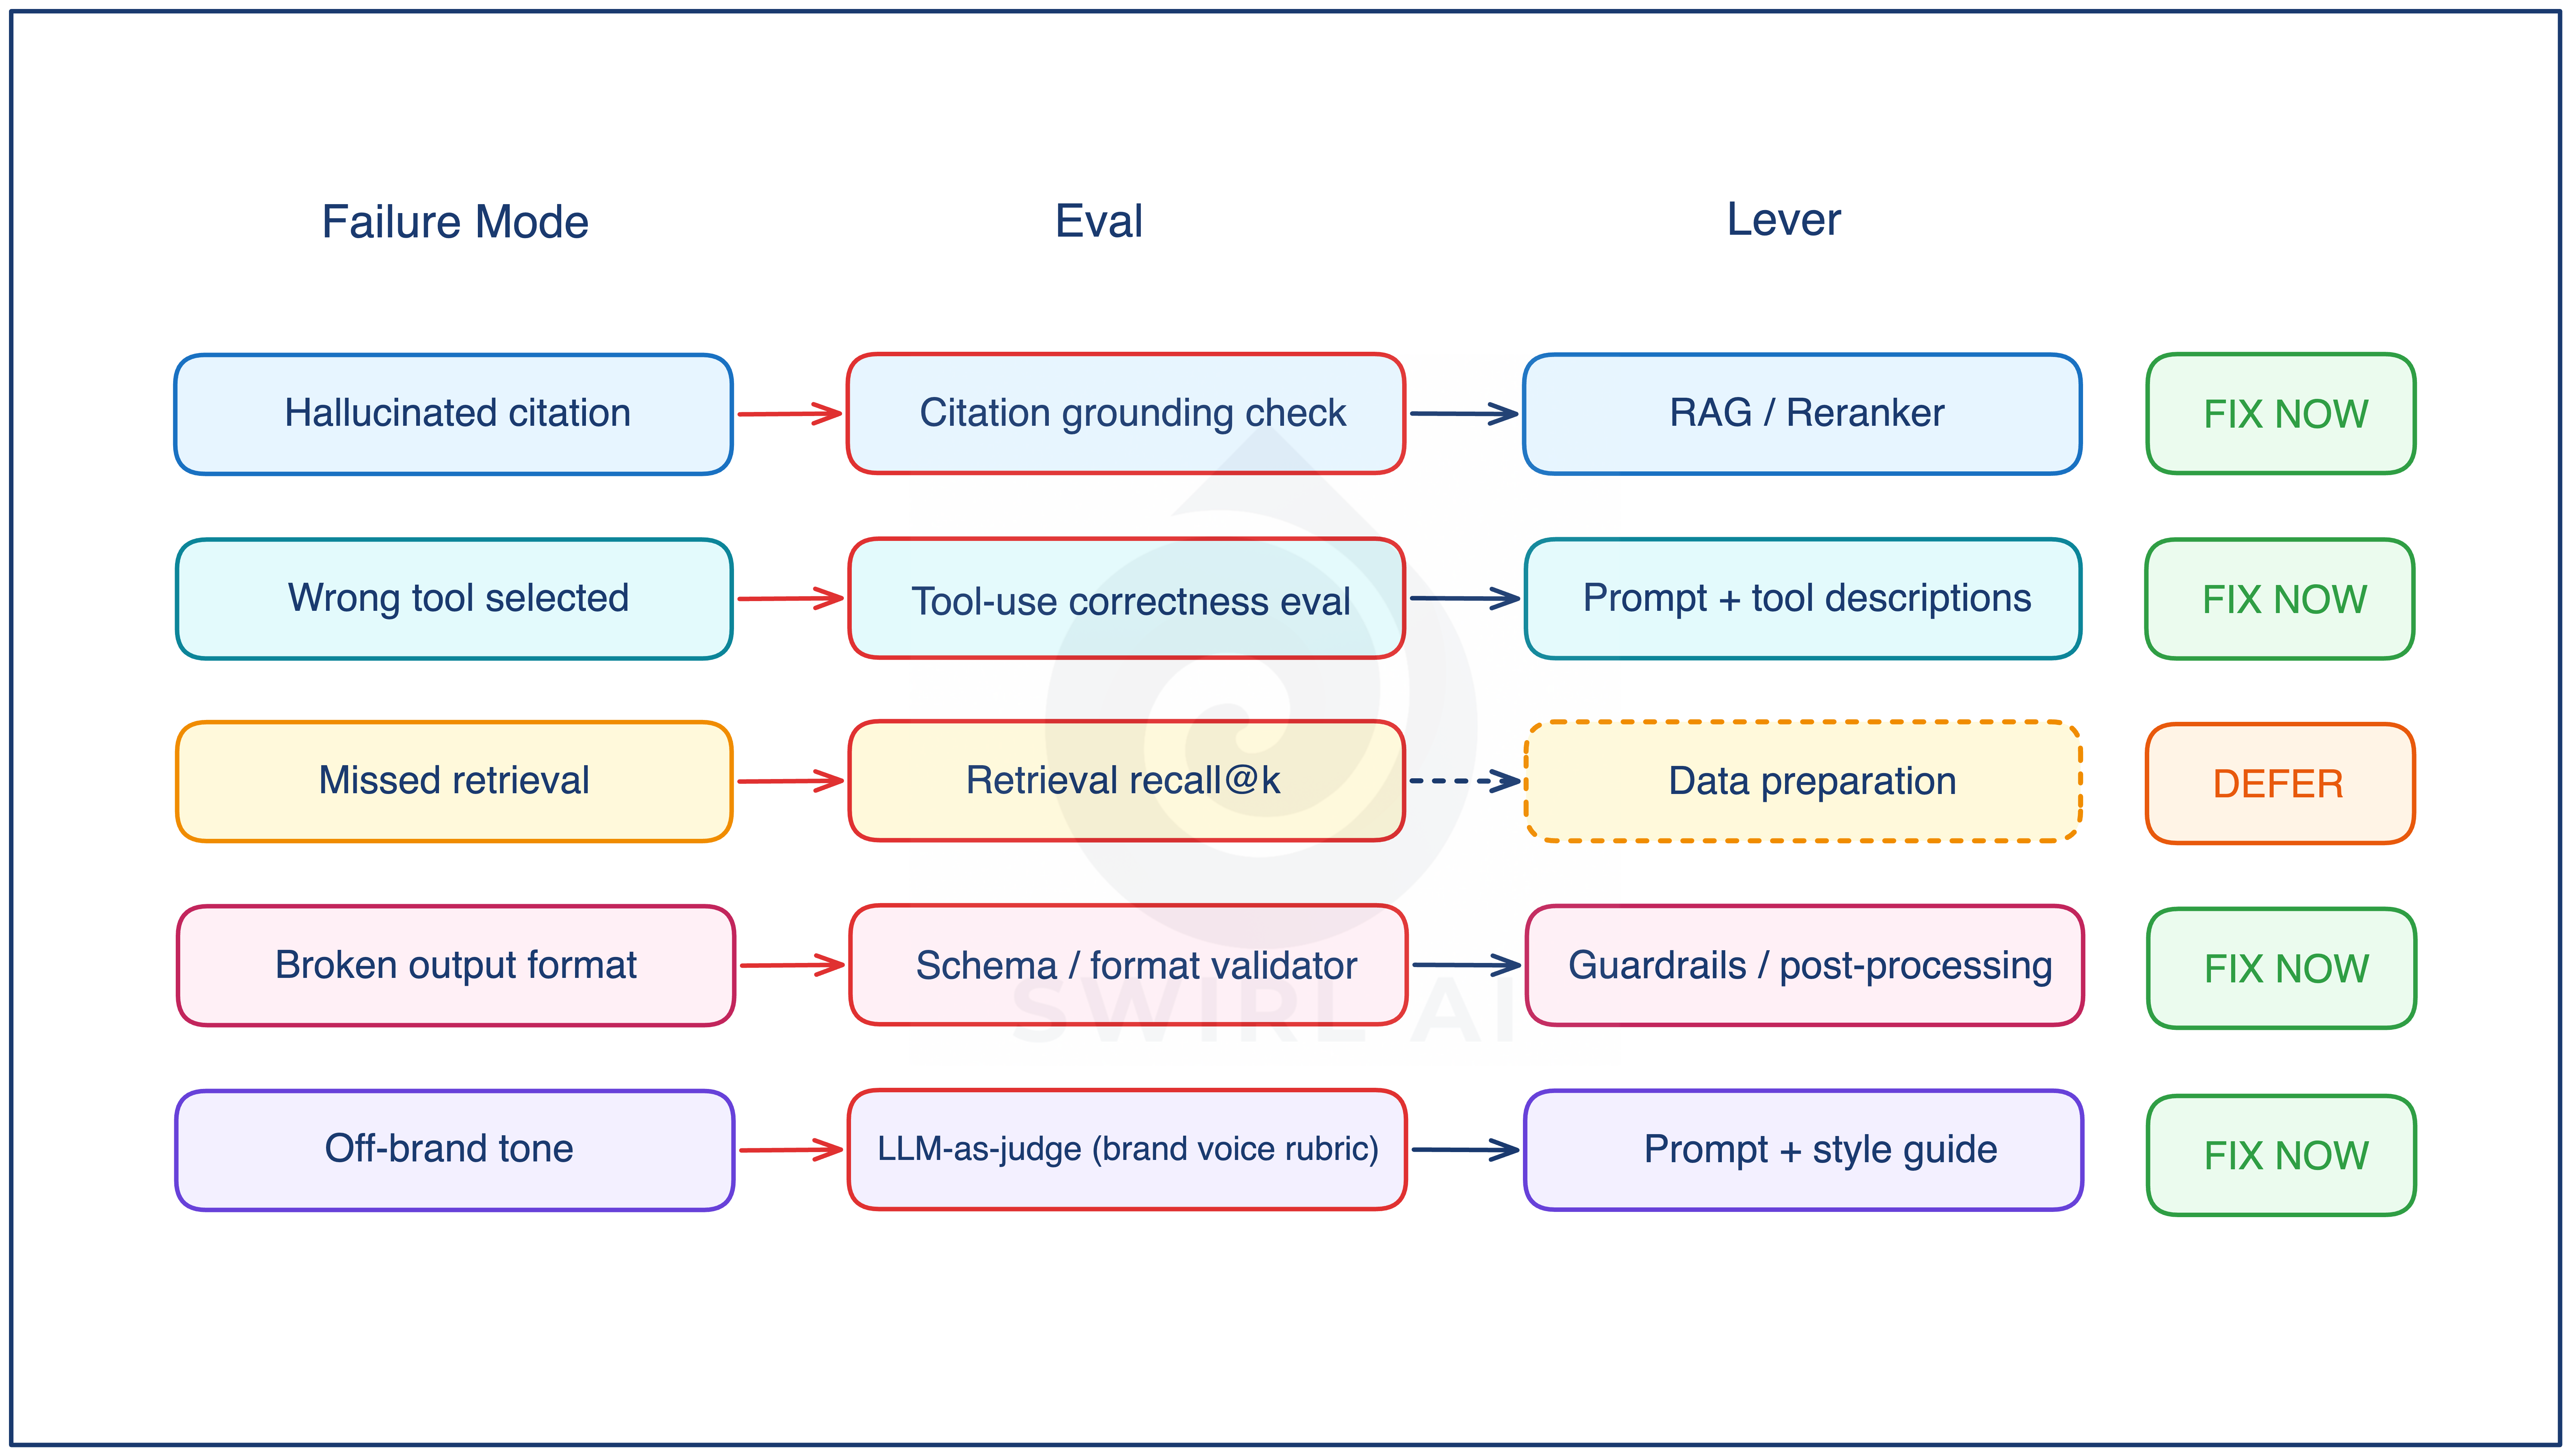
The error mode chooses the eval type, not team preference. The five categories below are the ones the talk used as worked examples, because each represents a distinct implementation pattern. They are not exhaustive. Safety and policy evals (toxicity, PII leakage, jailbreak resistance), cost and latency evals, multi-turn trajectory evals, pairwise preference comparisons, and code-execution evals all exist and have their place in mature systems. Treat the five below as an example set, not a complete list.
1. Citation grounding check. Factual verification. For every citation in the output, verify that the cited source was actually in the retrieved context, and that the claim in the output is supported by that source. Two implementation flavors: programmatic (string match against the retrieved set, fast, catches the “source was never retrieved” case) and LLM-assisted (a judge model reads the claim plus the source and returns supported or not, catches the “source was retrieved but does not actually support the claim” case). This one can be used as day-one eval for any RAG system that cites.
2. Tool-use correctness. Deterministic. Labeled inputs where you know the expected tool call and arguments. Compare actual to expected. Pure code, no model in the grading path. Cheapest eval to run and fastest signal in CI. If a code path can check it, do not pay for a model.
3. Retrieval recall@k. Information retrieval metric. Labeled queries with known-relevant documents. Measure whether the right document lands in the top-k retrieved set. Decades of precedent from search and information retrieval. Often ships with a DEFER badge because retrieval fixes (rebuilding chunking, switching embeddings, adding a reranker) are weeks of work. The eval ships today and sits in CI until the fix lands.
4. Schema or format validator. Deterministic structural check. Parse the output against a JSON schema, a regex, or a type definition. Zero ambiguity. If the downstream system is a parser, this eval is non-negotiable, because structural failures break silently everywhere else.
5. LLM-as-judge with a rubric. Subjective, model-graded. A judge model reads the output and a rubric, and returns a score or a label. The only category that covers subjective quality (tone, helpfulness, brand voice). Also the riskiest: judge models drift, rubrics need versioning, judge prompt stability matters. Standard practice is to pin the judge model version, calibrate against a small human-labeled set, and re-calibrate whenever the rubric or the judge model changes.
Two practical notes on the mix:
The eval set is always heterogeneous. A team running only LLM-as-judge is grading subjective quality and missing structural and factual failures that pure code would catch. A team running only deterministic evals is missing the subjective dimension.
The judge needs its own evals. You are about to grade thousands of production responses with it, so you should know it grades consistently with a human first.
Improve
Each named error mode points at a specific lever in the system: retrieval, reranking, prompts, tool descriptions, data preparation, guardrails, model routing, or finetuning. The mapping is what turns triage output into an engineering plan.
For the support agent error modes above, the lever assignments are usually:
Hallucinated citation → RAG / reranker
Wrong tool selected → prompt + tool description
Missed retrieval → data preparation (chunking, embeddings)
Broken output format → guardrails / structured output enforcement
Off-brand tone → prompt + style guide or finetuning
Changes ship through CI/CD with the eval set as the gate. The artifact at this stage is a new version of the system that passes every existing eval before release, and that version is the next Ship. The loop closes.
Define vs Run
With the loop in view, the eval set has two distinct roles that often get collapsed.
Defining an eval is the act of writing the specification: the input, the expected behavior, the grader. It happens at two surfaces only.
Prototype, pre-production. Synthetic data generation plus historical human work.
Error Analysis, in-production. Every named error mode becomes a new eval.
Running an eval is the act of executing it against data. It happens at three surfaces.
CI/CD gates, on every pull request. The eval set is the regression contract.
Observability Platform, continuously on sampled production traffic. The same evals you gate releases with also run as monitors.
Error Analysis itself, replaying past traces against the current eval set. Useful when you add a new eval and want to know how often the failure occurred historically.
Two patterns follow from the split. New evals always originate from one of two surfaces (Prototype or Error Analysis). The same eval set is reused across three execution surfaces, with CI/CD as only one of them.
Drift capture
Drift is what makes the loop necessary in the first place. Without it, a well-tuned production agent would slowly tighten and converge. With drift, the target moves, the system that works on assumption that drift does not exist adjusts for the current state of the world but inevitably degrades in performance as the environment shifts.
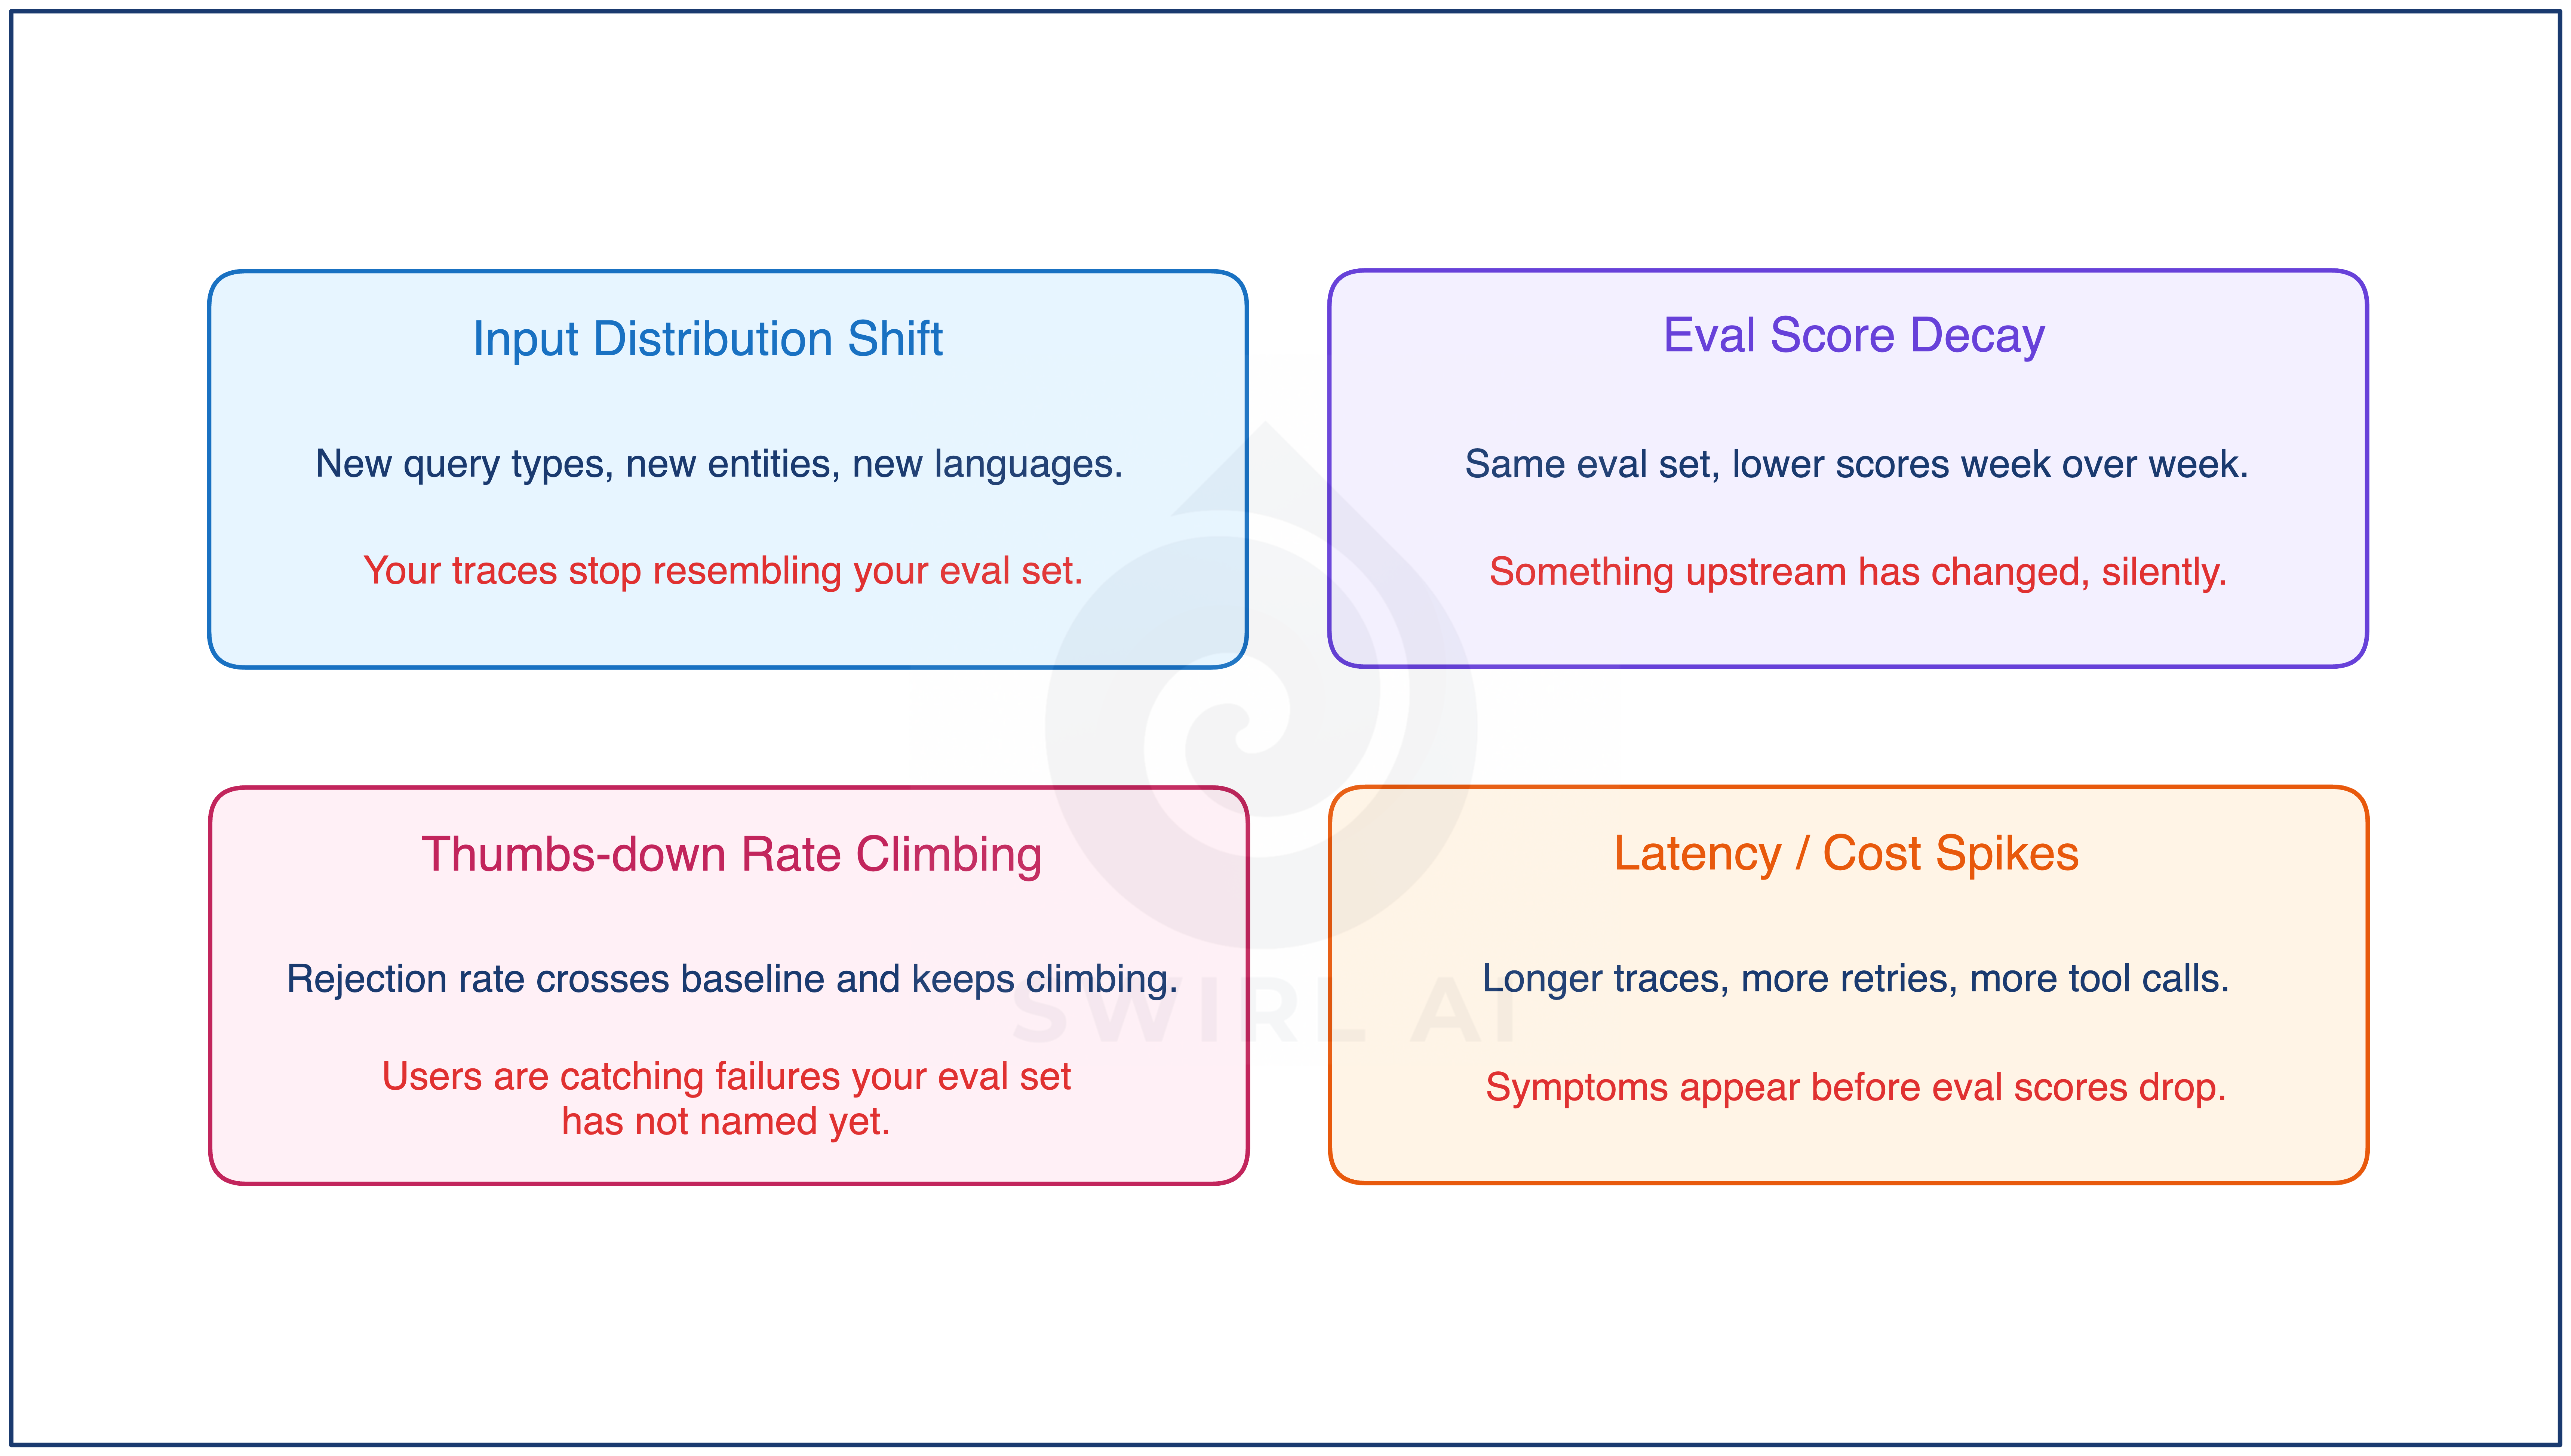
Drift shows up in four signals.
Input distribution shift. Queries you never saw before. New vendor names in invoices, new SKUs in support tickets, new intents in chat traffic.
Eval score decay over time. Same eval set, lower average scores. The system did not change, the data did.
Thumbs-down rate climbing. Direct human feedback. Trailing indicator, but reliable.
Latency or cost spikes. Often not about quality directly, but a leading indicator that retrieval is returning longer contexts, or the model is taking more tool-call iterations to finish. Both usually precede a quality drop.
The response is the same loop, reopened on the drifted slice. Pull the drifted traffic into Error Analysis, cluster the new error modes, write the new evals, update the context engineering levers, ship.
Drift capture is also where alerting becomes more important as the system scales. Continuous review handles drift while the volume is small. Alerts catch it after volume scales past what a human reviewer can realistically cover.
The eval set as the central artifact
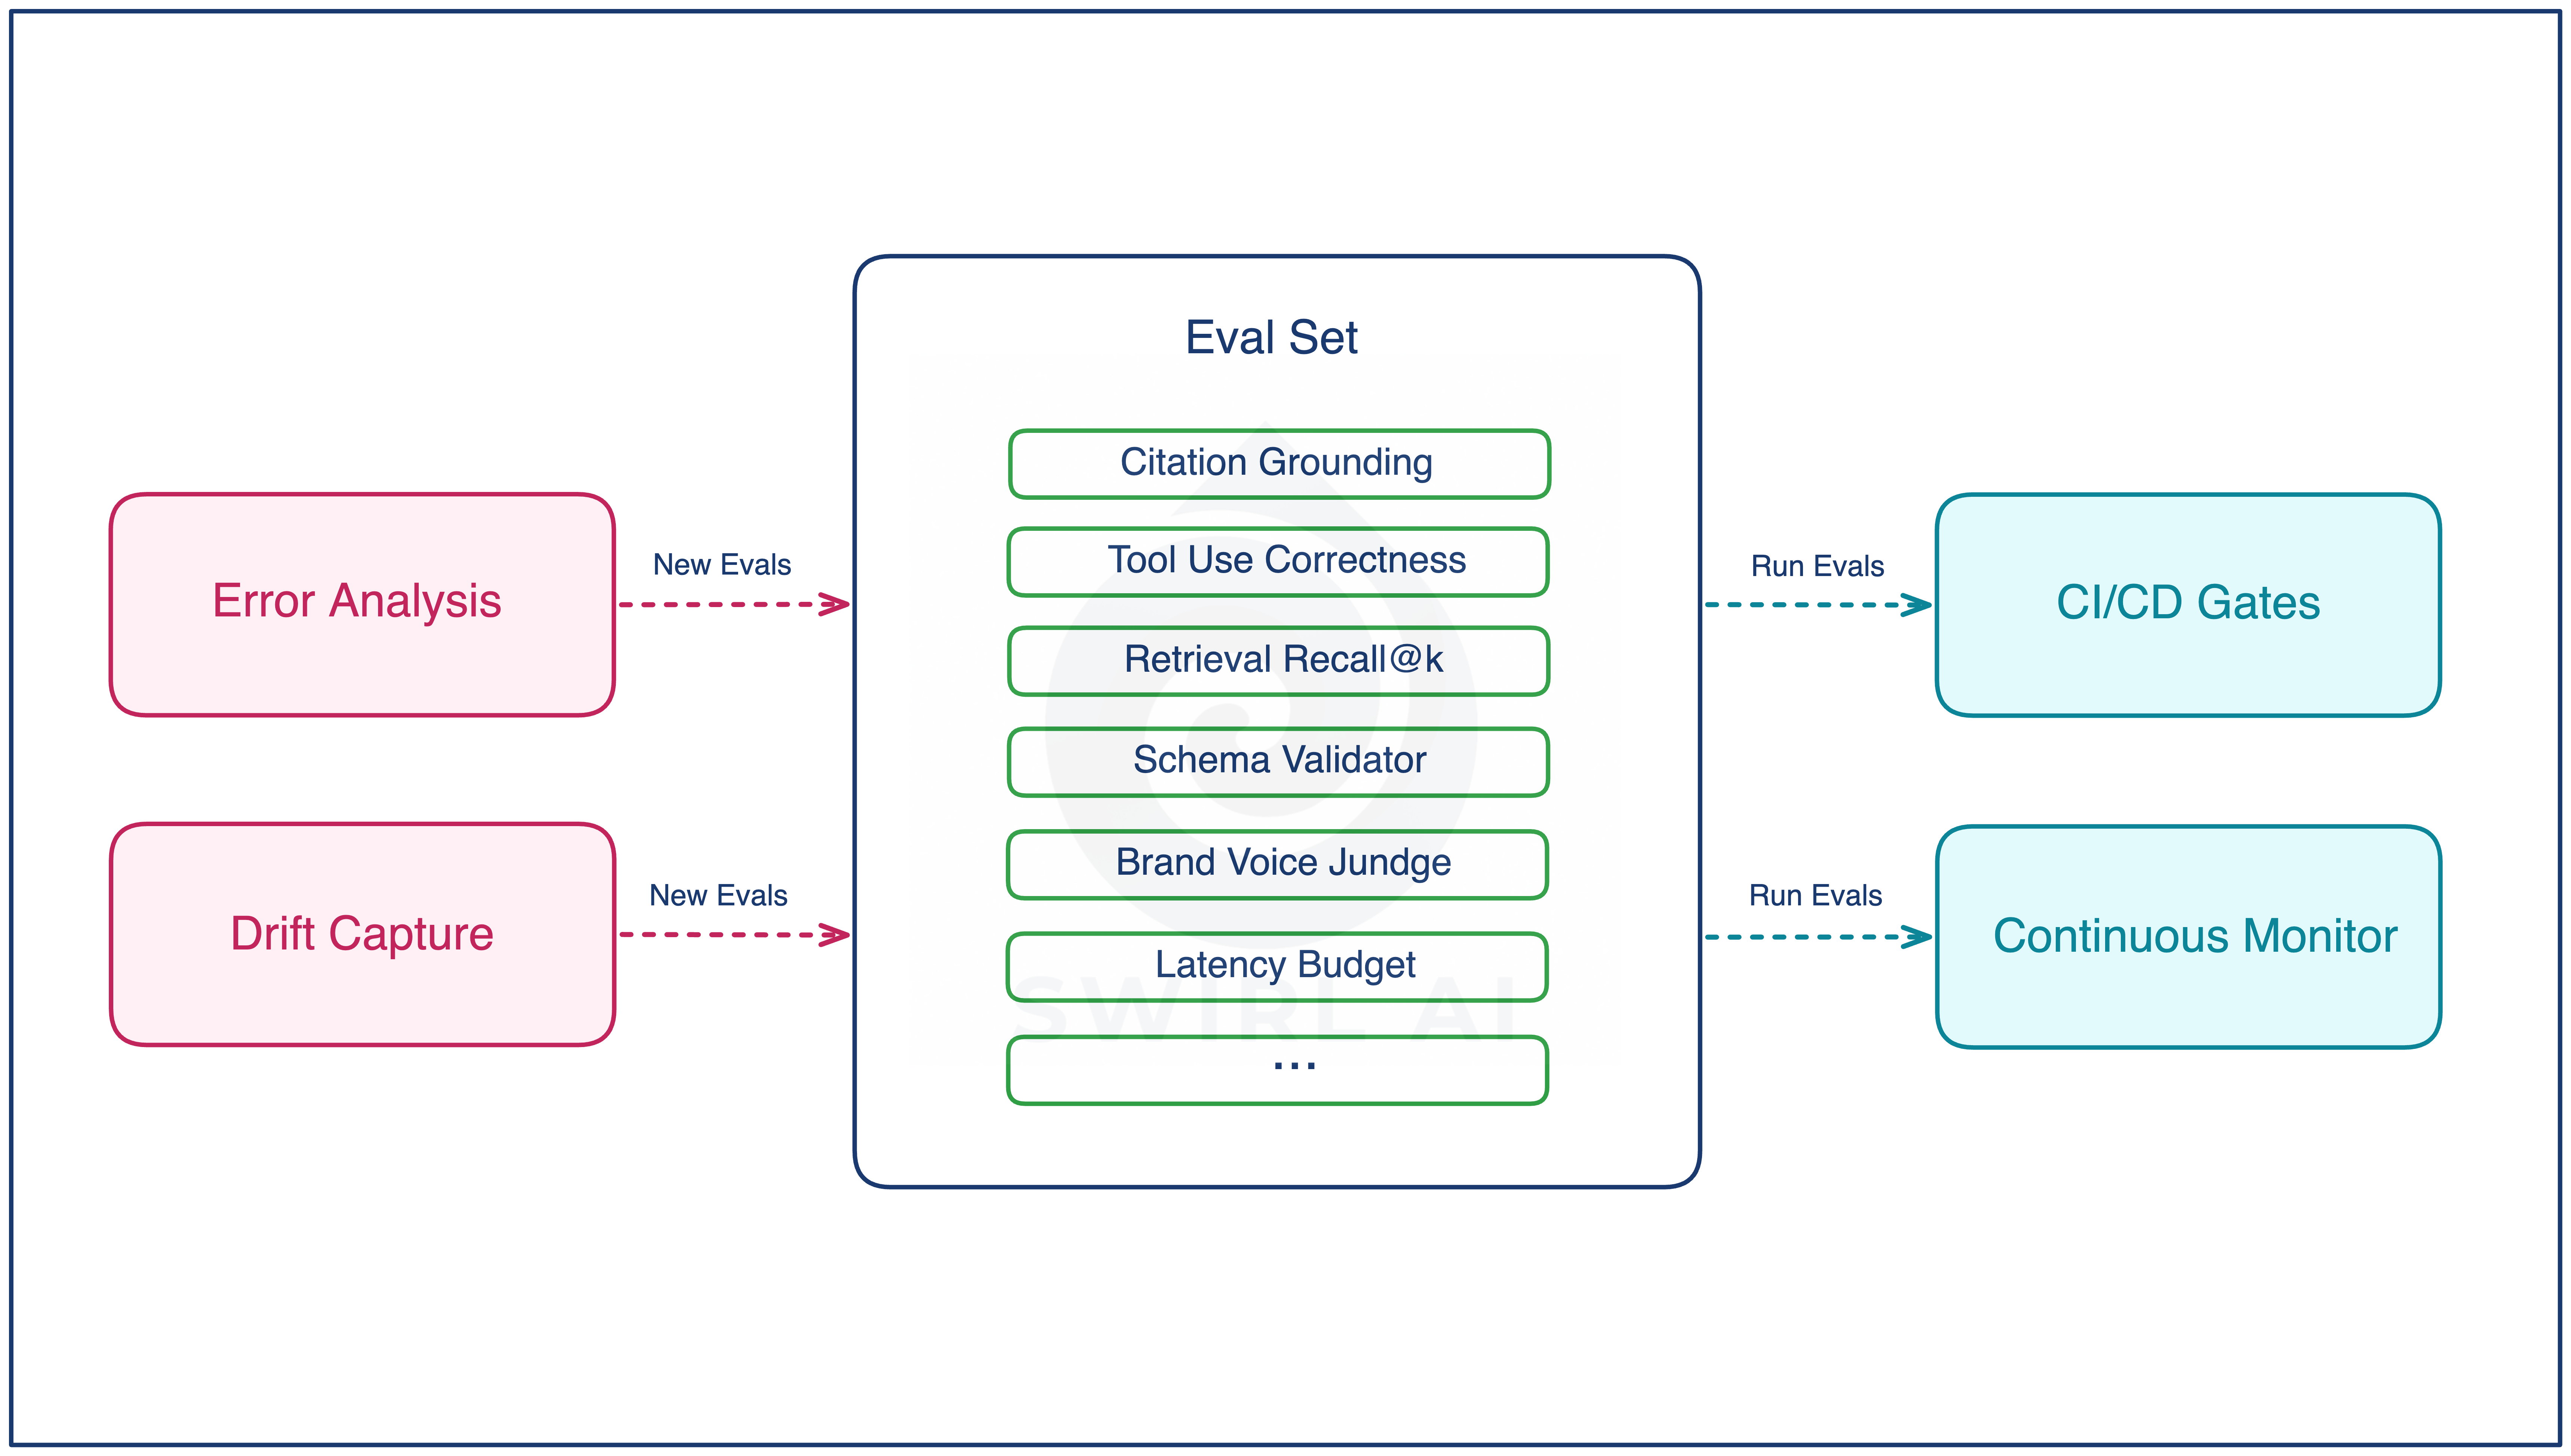
Once the loop is running, the eval set is what every other phase feeds.
Error analysis spawns new evals, one per named error mode, written at triage time.
Drift capture spawns new evals, one per new failure shape surfaced from drifted traffic.
Prototype seeded the initial set, from synthetic data and historical human work.
CI/CD gates and the production monitor both consume it as the contract every new version has to satisfy.
Coverage grows on every cycle of the loop, because the loop produces evals as a byproduct and the new evals do not depend on engineering finding time to ship a fix to earn their place. Over a few months, this is the difference between a system whose quality bar is whatever the team remembers to check, and a system whose quality bar is every failure mode ever seen in production.
Closing thoughts
Write the eval the moment you name the error mode. The fix is a separate scheduling decision. This is the single ordering change that decouples eval growth from engineering throughput.
Calibrate every LLM-as-judge against a small human-labeled set, pin the judge model version, and re-calibrate when the rubric or model changes.
Separate Define from Run. New evals come from Prototype and Error Analysis. The same set runs in CI/CD gates and as a continuous monitor on production traffic.
Run error analysis on traces and feedback continuously, day one, with no alerting in place. Add alerting as volume scales past human review.
Make drift capture explicit. Watch input distribution shift, eval score decay, thumbs-down rate, and latency or cost. Feed the drifted slice back into error analysis.
Hope you learned something new and hope to see you in the next episode!
Happy implementation!
hey, great post. we are building this as an agentic system "ai engineer". would love to discuss and get your input!