
Data Pipelines in Machine Learning Systems.
A hands-on tutorial of real time web data ingestion pipeline followed by Apache Spark based ETL.

👋 I am Aurimas. I write the SwirlAI Newsletter with the goal of presenting complicated Data related concepts in a simple and easy-to-digest way. My mission is to help You UpSkill and keep You updated on the latest news in GenAI, MLOps, Data Engineering, Machine Learning and overall Data space.
AI and AI Agents are the topic of 2025. However, we often overlook the crucial element that drives these applications - Data.
Data Pipelines in Machine Learning Systems can become complex and for a good reason.
It is critical to ensure Data Quality and Integrity upstream of ML Training and Inference Pipelines, trying to do that in the downstream systems will cause unavoidable failure when working at scale.
Example architecture for a production grade end-to-end data flow:
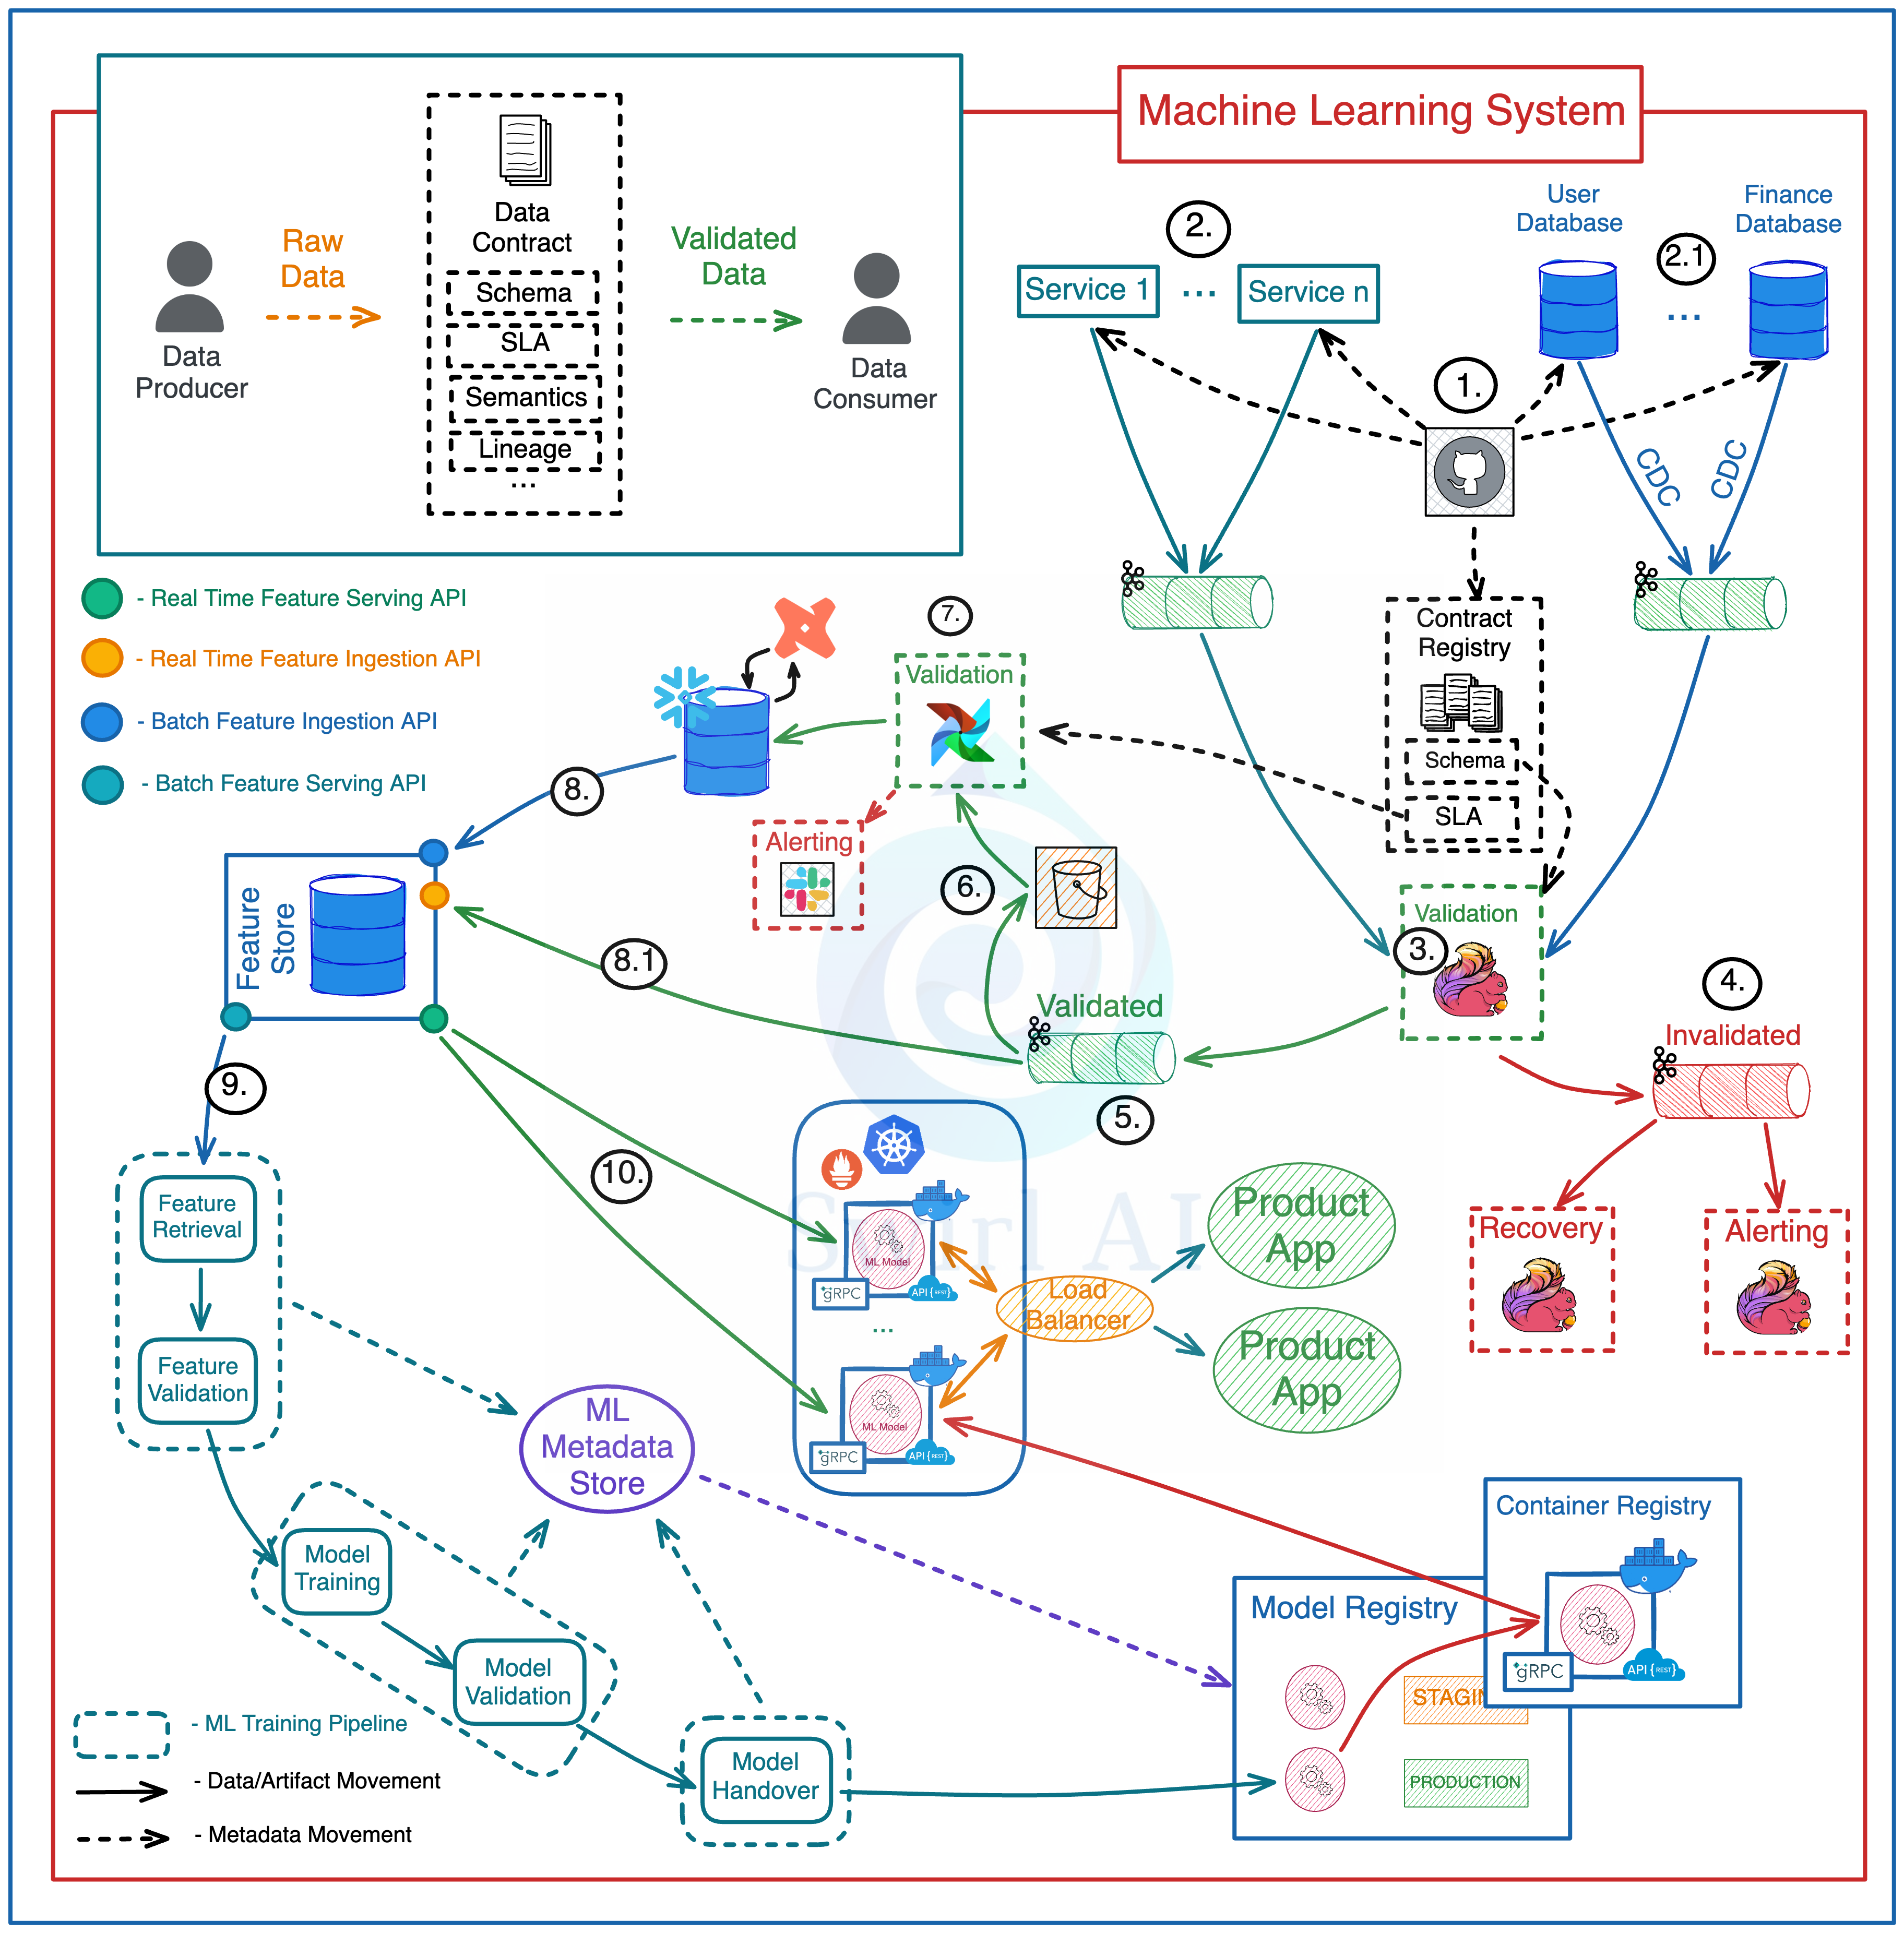
Schema changes are implemented in version control, once approved - they are pushed to the Applications generating the Data, Databases holding the Data and a central Data Contract Registry.
Events emitted directly by the Application Services or via CDC to Kafka topics.
A Flink Application(s) consumes Data from Raw Data streams and validates it against schemas in the Contract Registry.
Data that does not meet the contract is pushed to Dead Letter Topic.
Data that meets the contract is pushed to Validated Data Topic.
Data from the Validated Data Topic is pushed to object storage for additional Validation.
On a schedule Data in the Object Storage is validated against additional SLAs in Data Contracts and is pushed to the Data Warehouse to be Transformed and Modeled for Analytical purposes.
Modeled and Curated data is pushed to the Feature Store System for further Feature Engineering.
High Quality Data is used in Machine Learning Training Pipelines.
The same Data is used for Feature Serving in Inference.
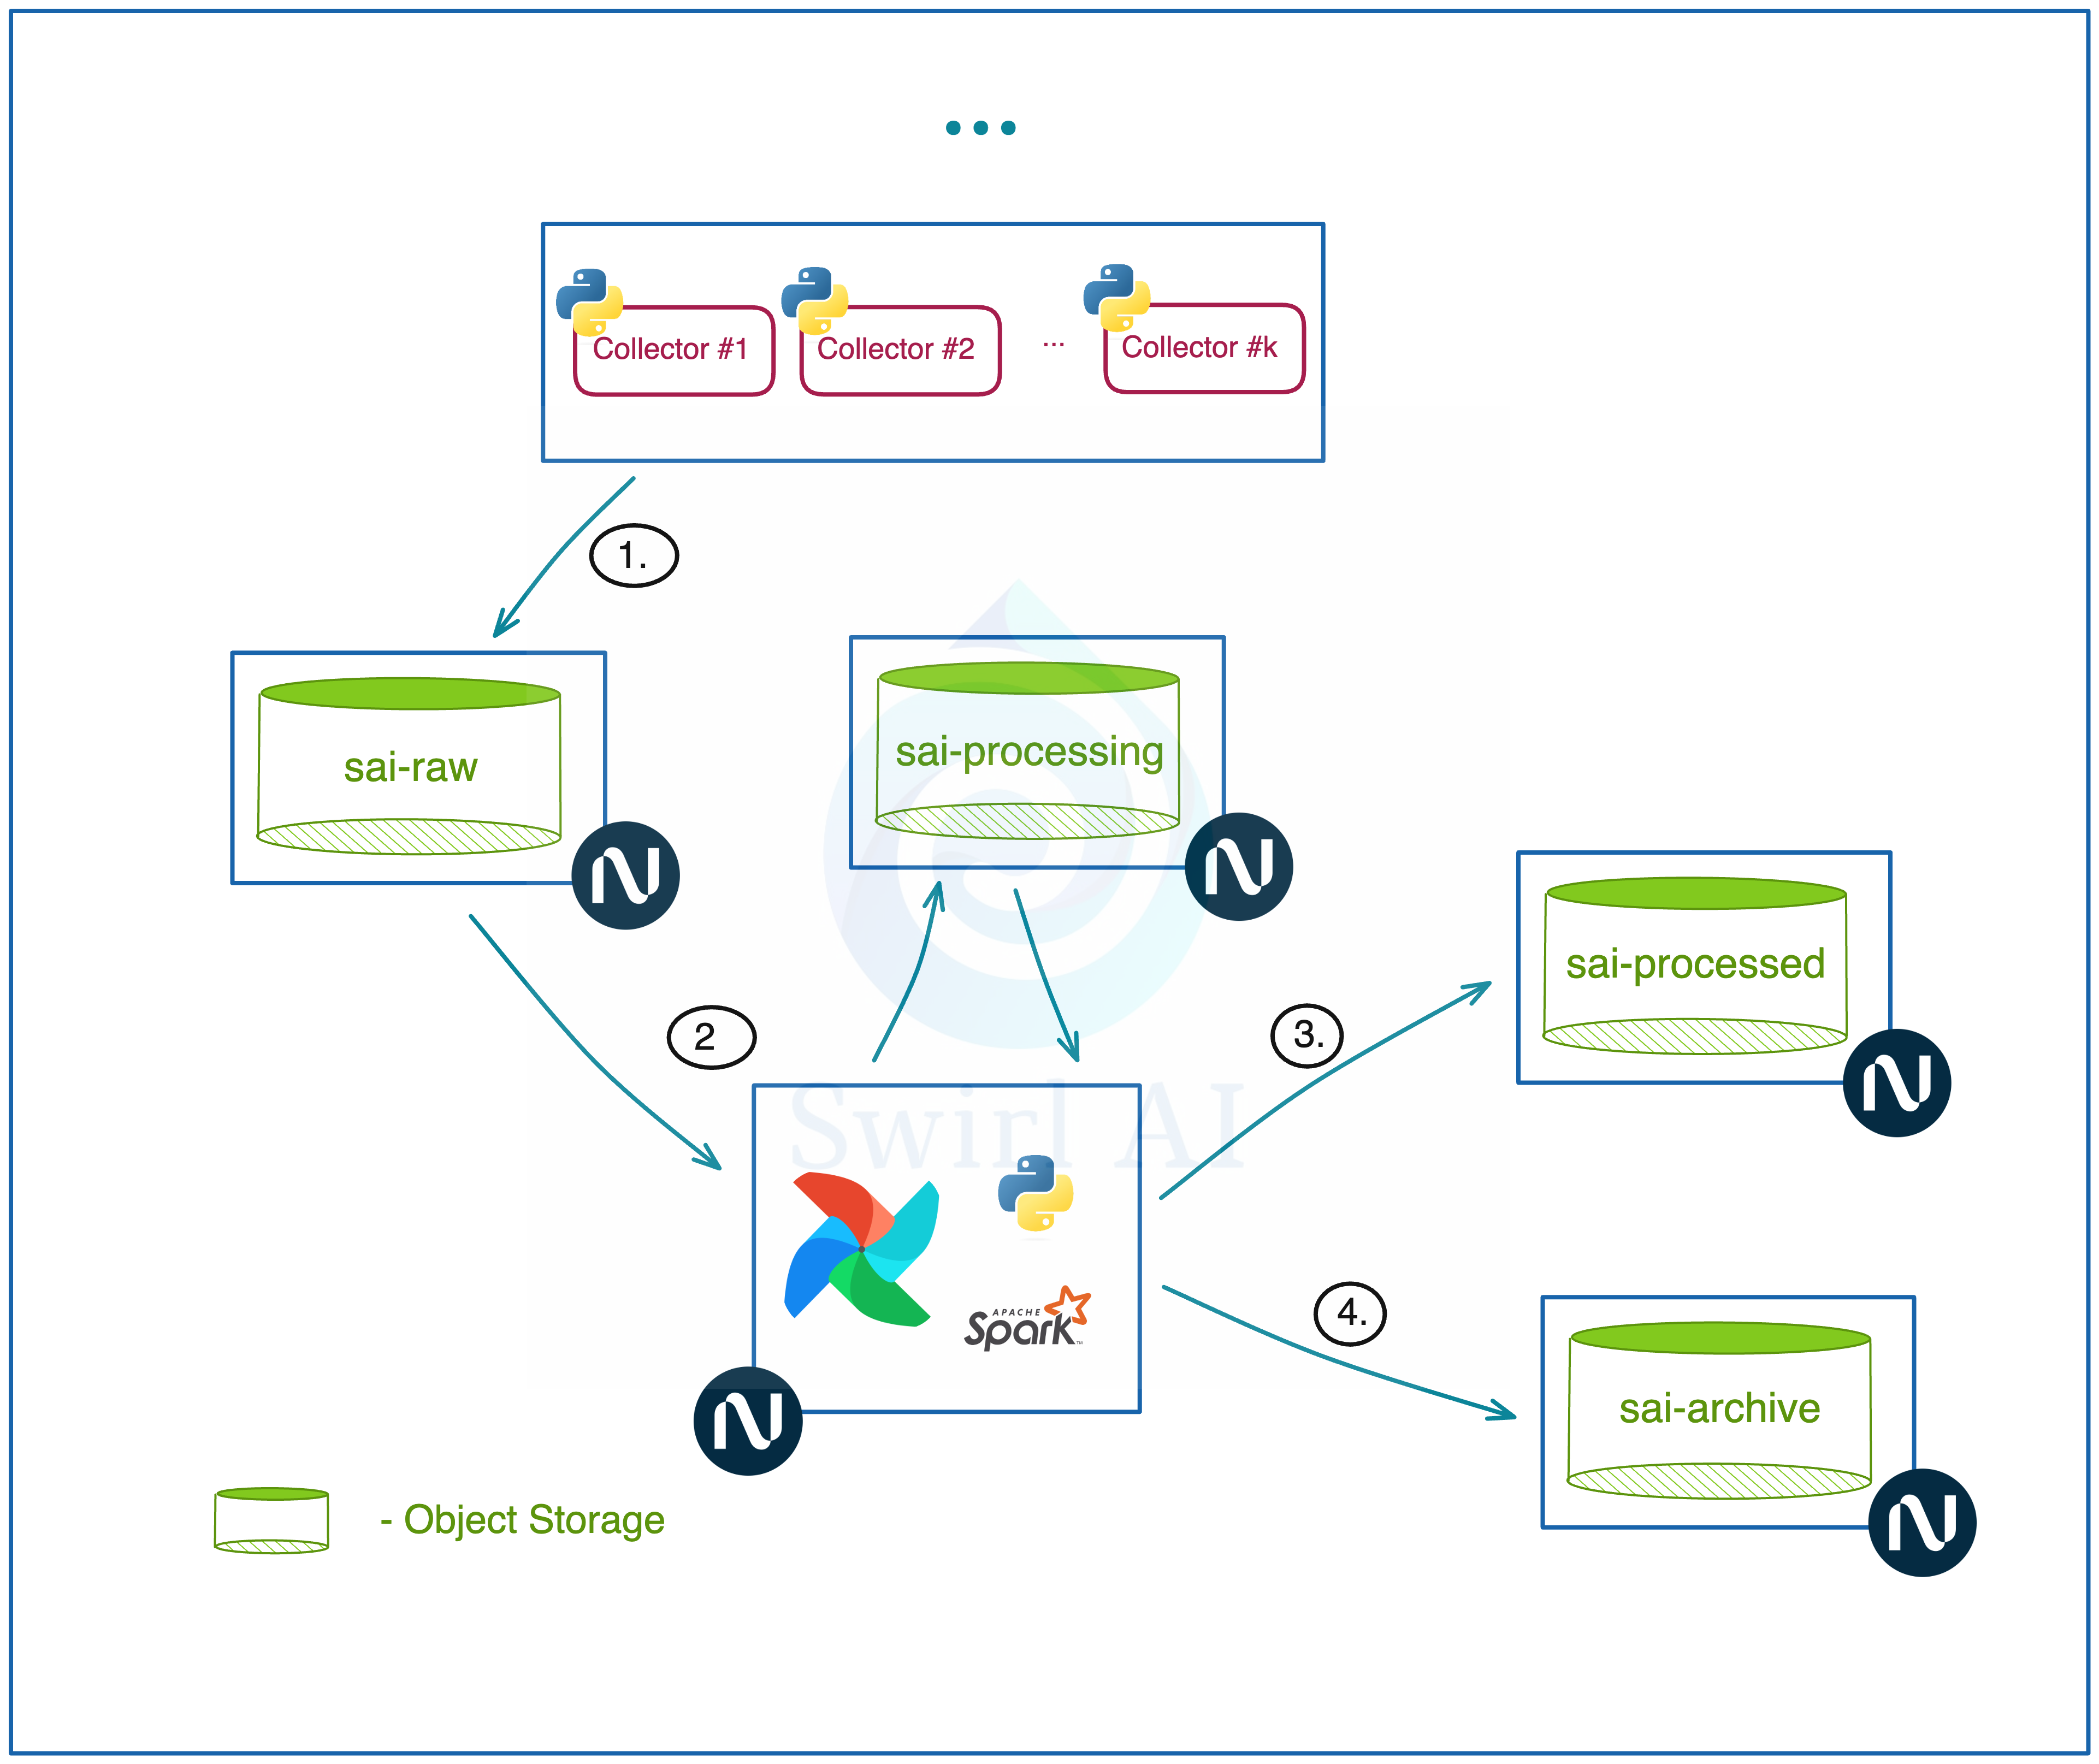
In this hands-on project Newsletter episode I am putting on my Data Engineer hat and we will implement a simplified real time data ingestion pipeline that represents a pipeline that you would see in production environments in real world:
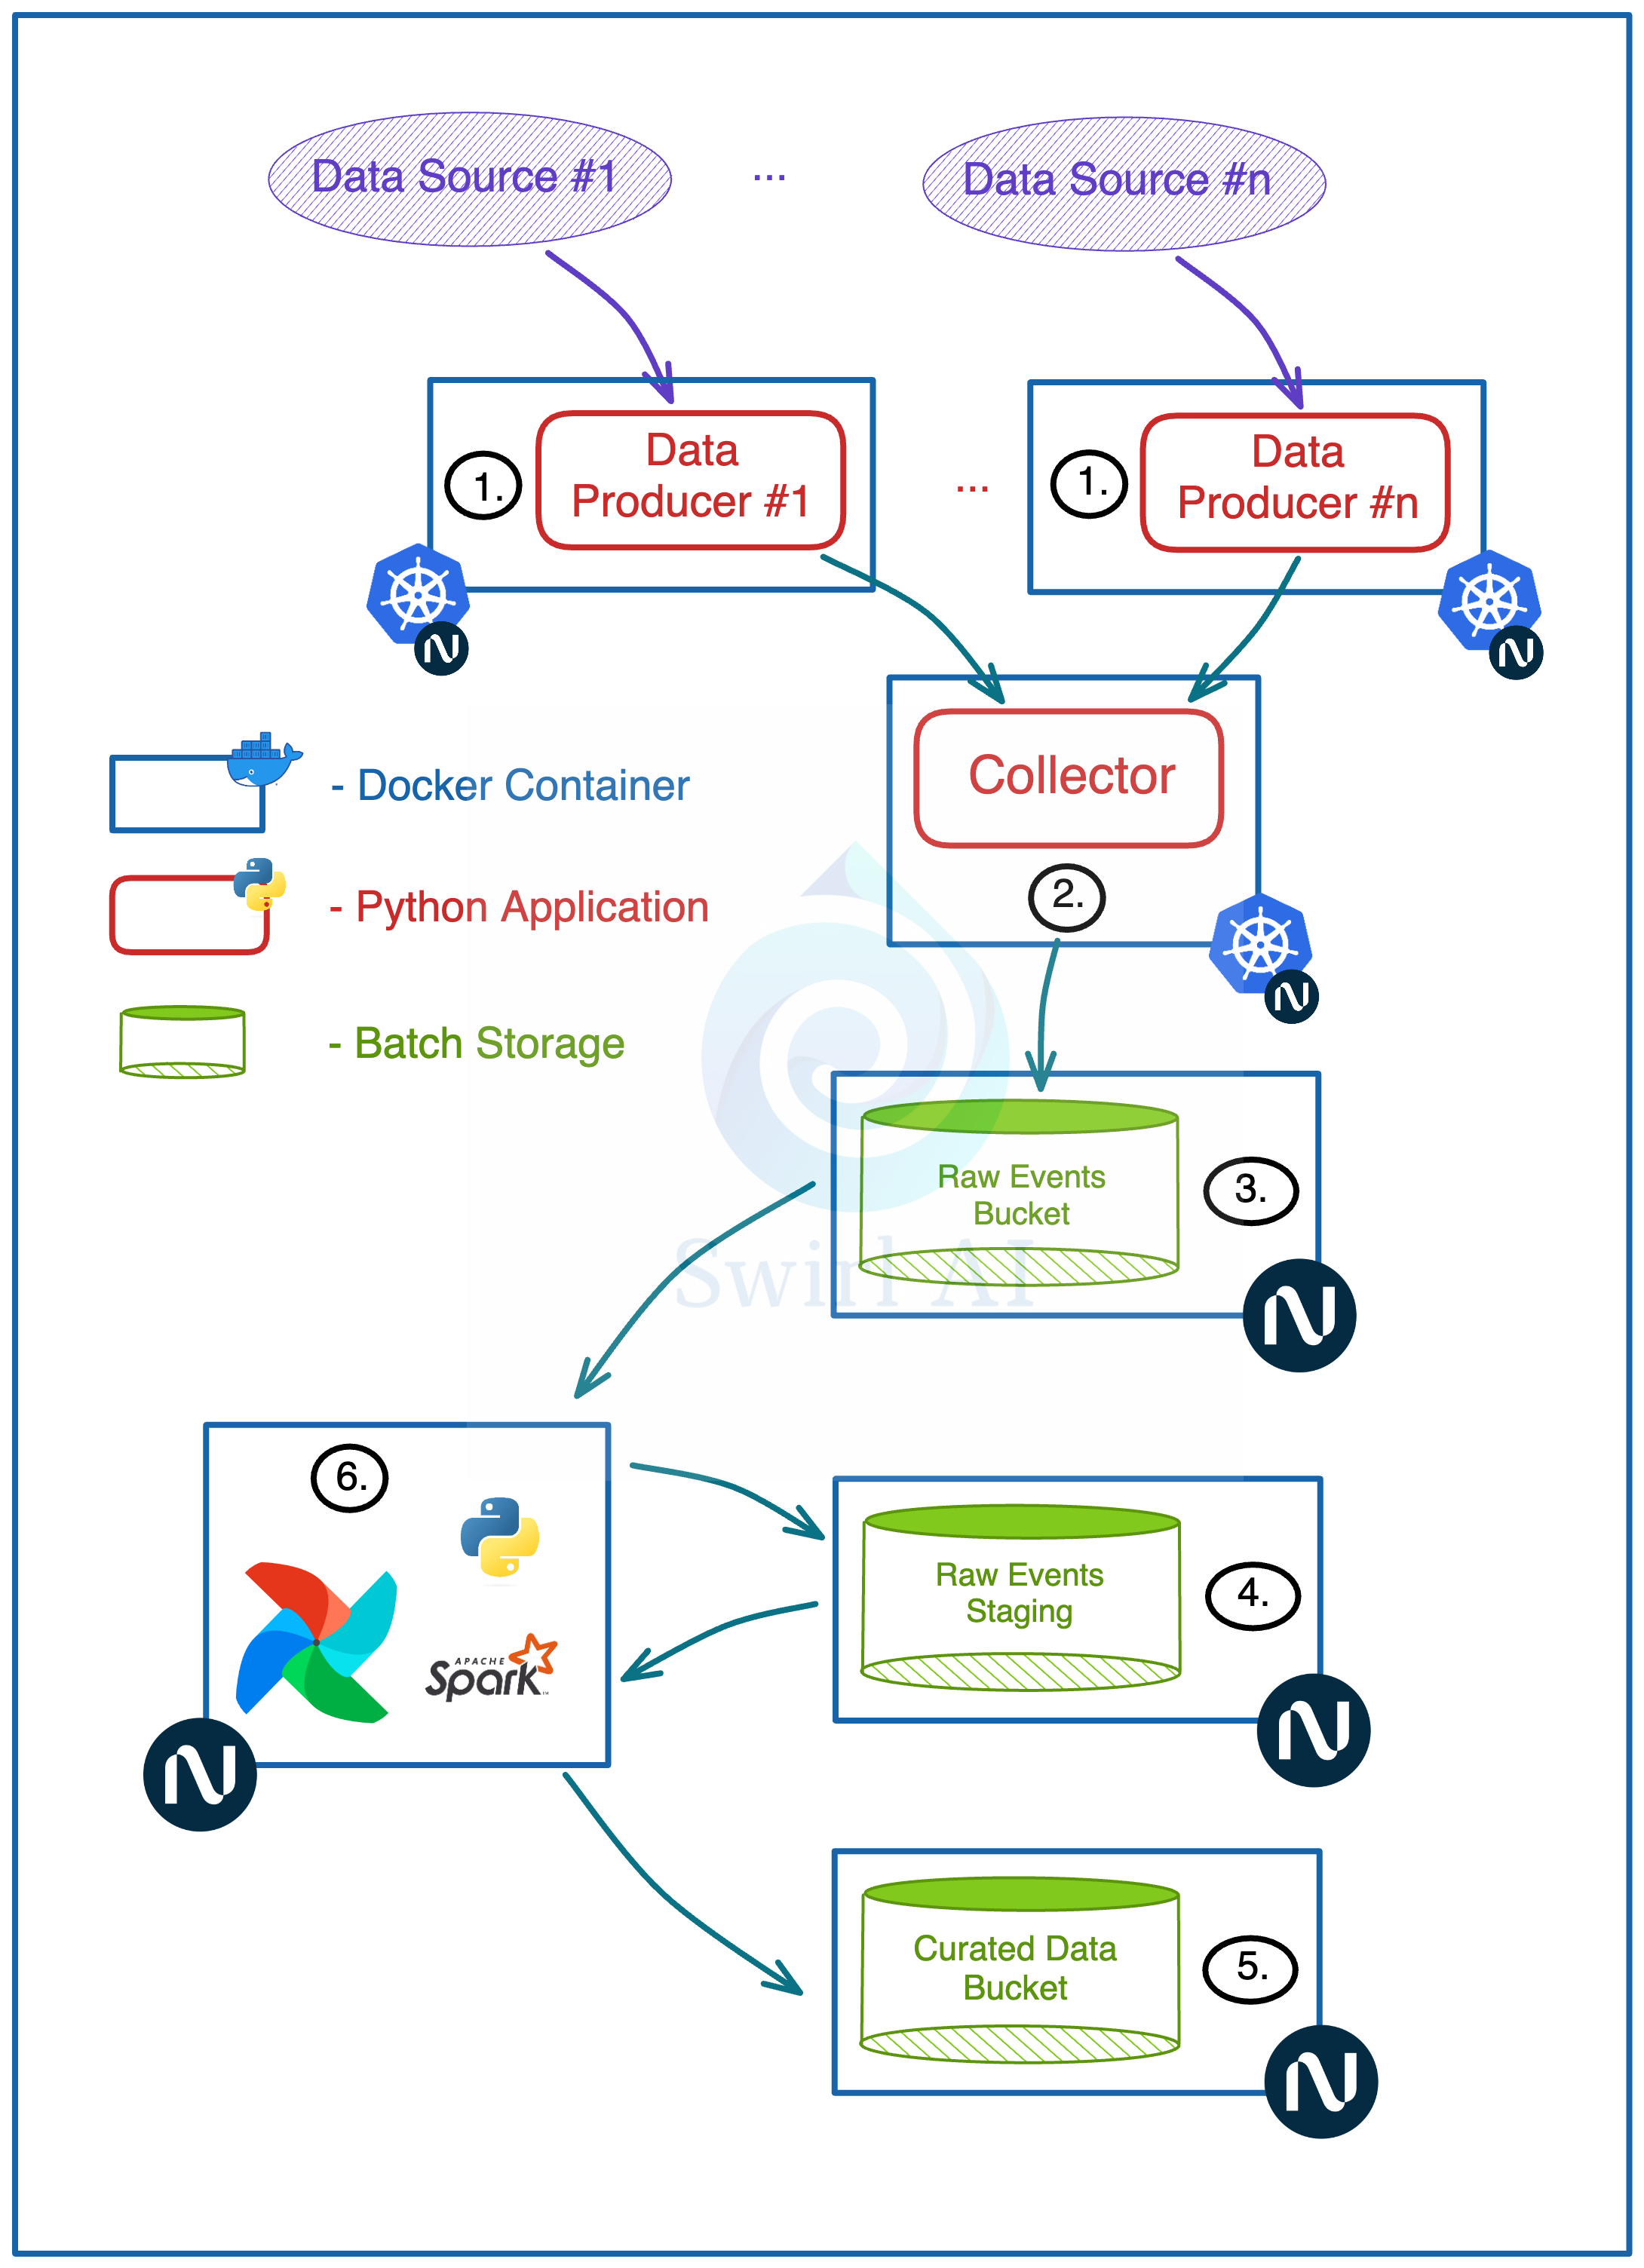
Data producers sending data to the collector service in real time.
Real time data ingestion via a collector service.
Batching and writing this data in object storage.
Raw data staged for further processing.
Batch Spark job that cleans, deduplicates and potentially enriches raw data.
Scheduled Airflow task that runs the ETL every N minutes.
I will explain why each part of the infrastructure is a good idea as we go through the project.
You can find all of the code to support you in this GitHub repository.
If you do run into any problems while following the project, let me know in the comment section or drop me a PM, we will solve it together.
This newsletter episode was made possible by Nebius - AI Cloud provider that has recently graduated to become one of the 4 AI Cloud giants. Congratulations!

Consider registering if you want to follow the tutorial, all of the pieces will deployed on Nebius platform. We will also use a Managed Service for Apache Spark service provided by Nebius.
Managed Service for Apache Spark is in a preview stage right now which means that you can run the clusters for free!
Lets go build.
We will start by implementing the Real Time Ingestion pipeline:
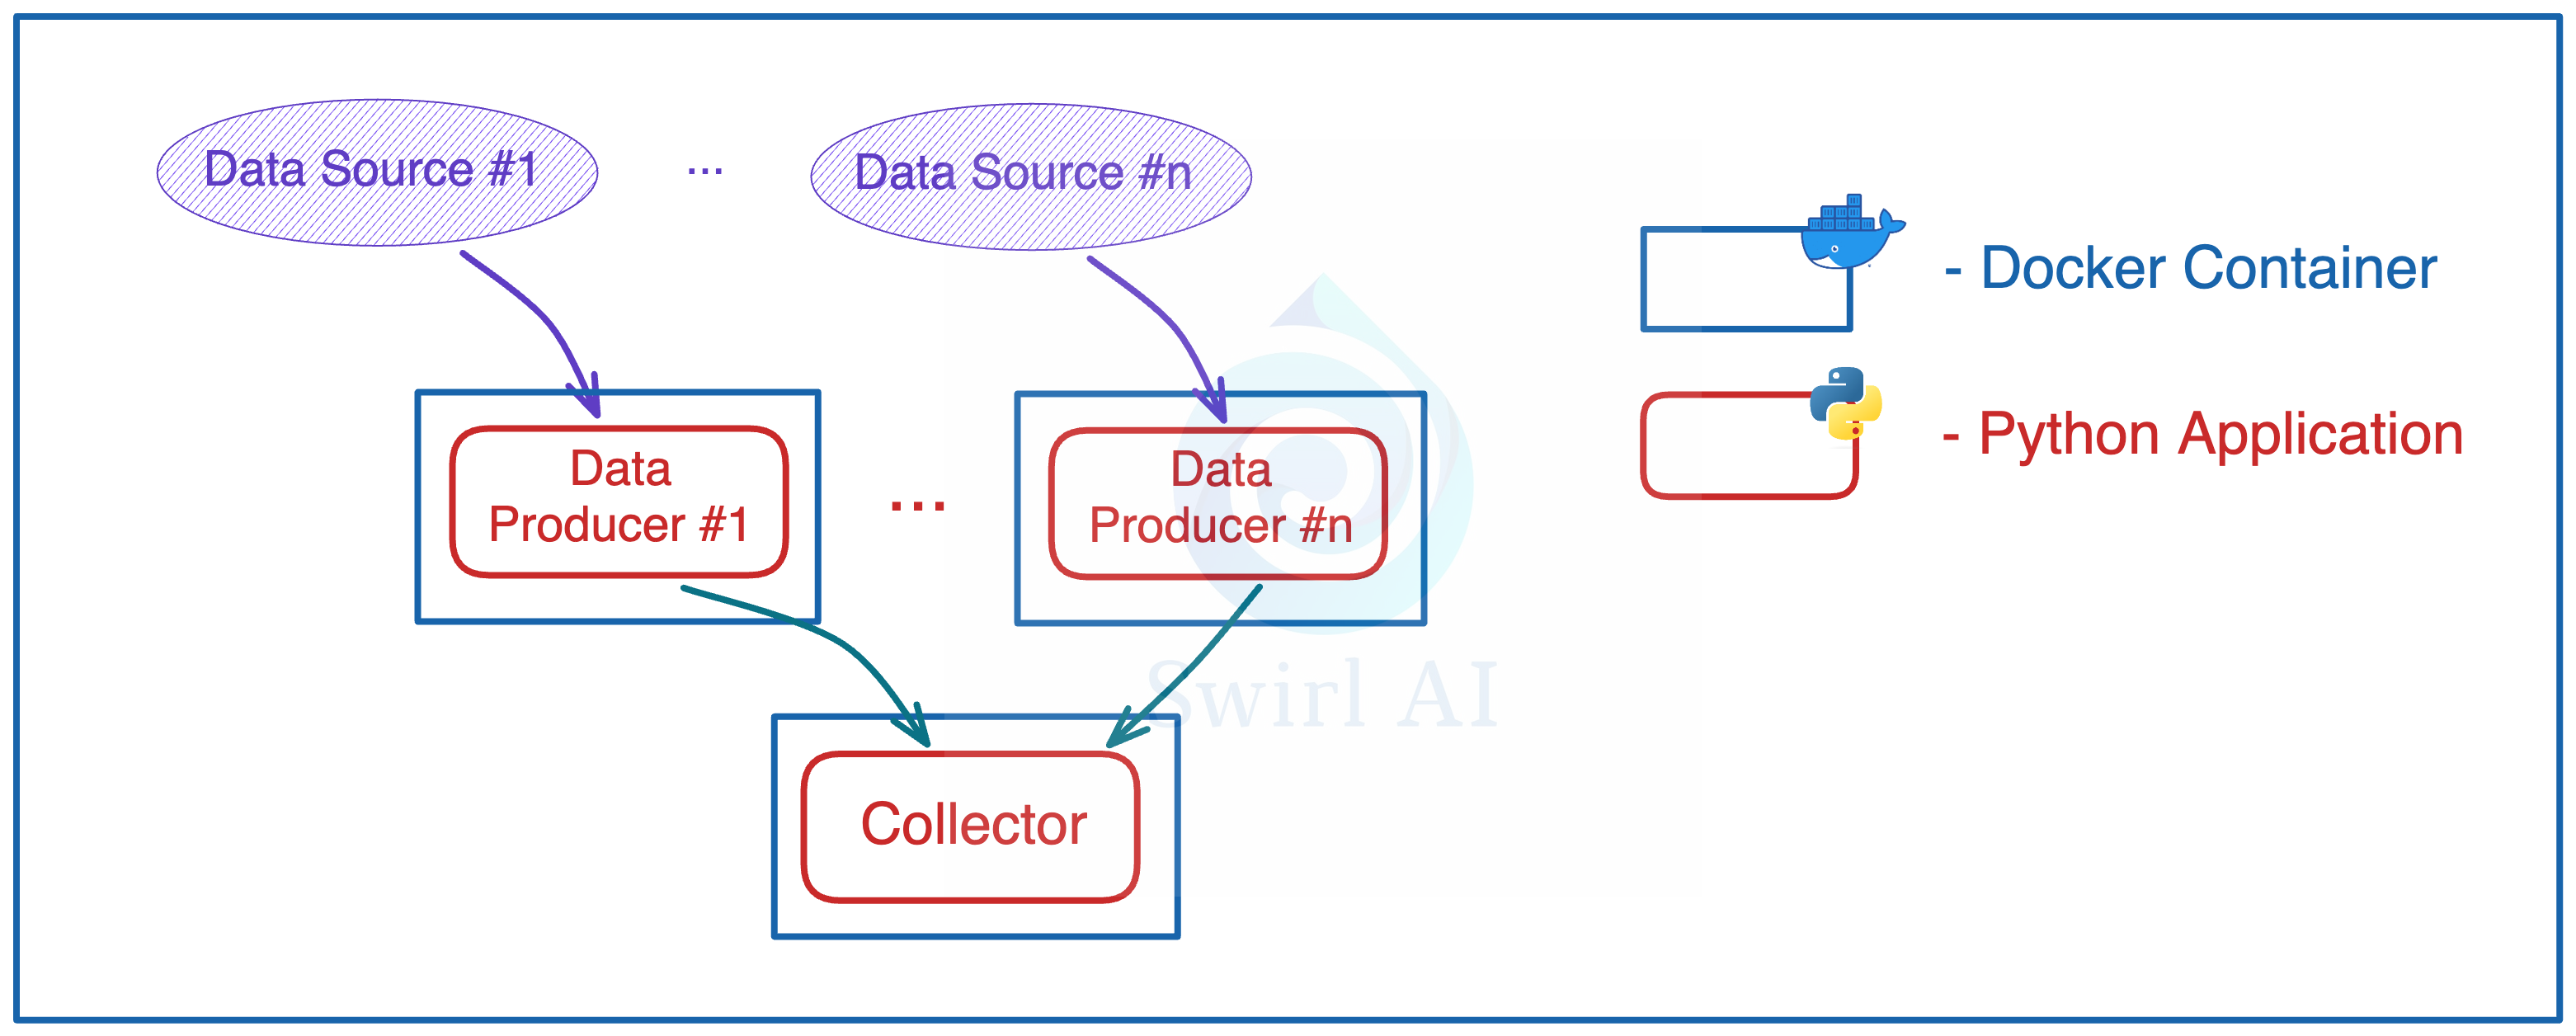
The Collector.
Write a Python application that uses FastAPI Framework to expose a REST API endpoint.
Deploy the application on Kubernetes.
Horizontally scale the application for High Availability
Data Producer.
Write a Python application to download data from the internet.
Run the application on Kubernetes.
Send the downloaded data to a previously deployed REST API endpoint.
Prerequisites.
This tutorial assumes that you know the basics of Python and have skimmed through my latest Guide to Kubernetes which you can find here.
Defining the Collector architecture.
The following is the first version of The Collector that we will be implementing:
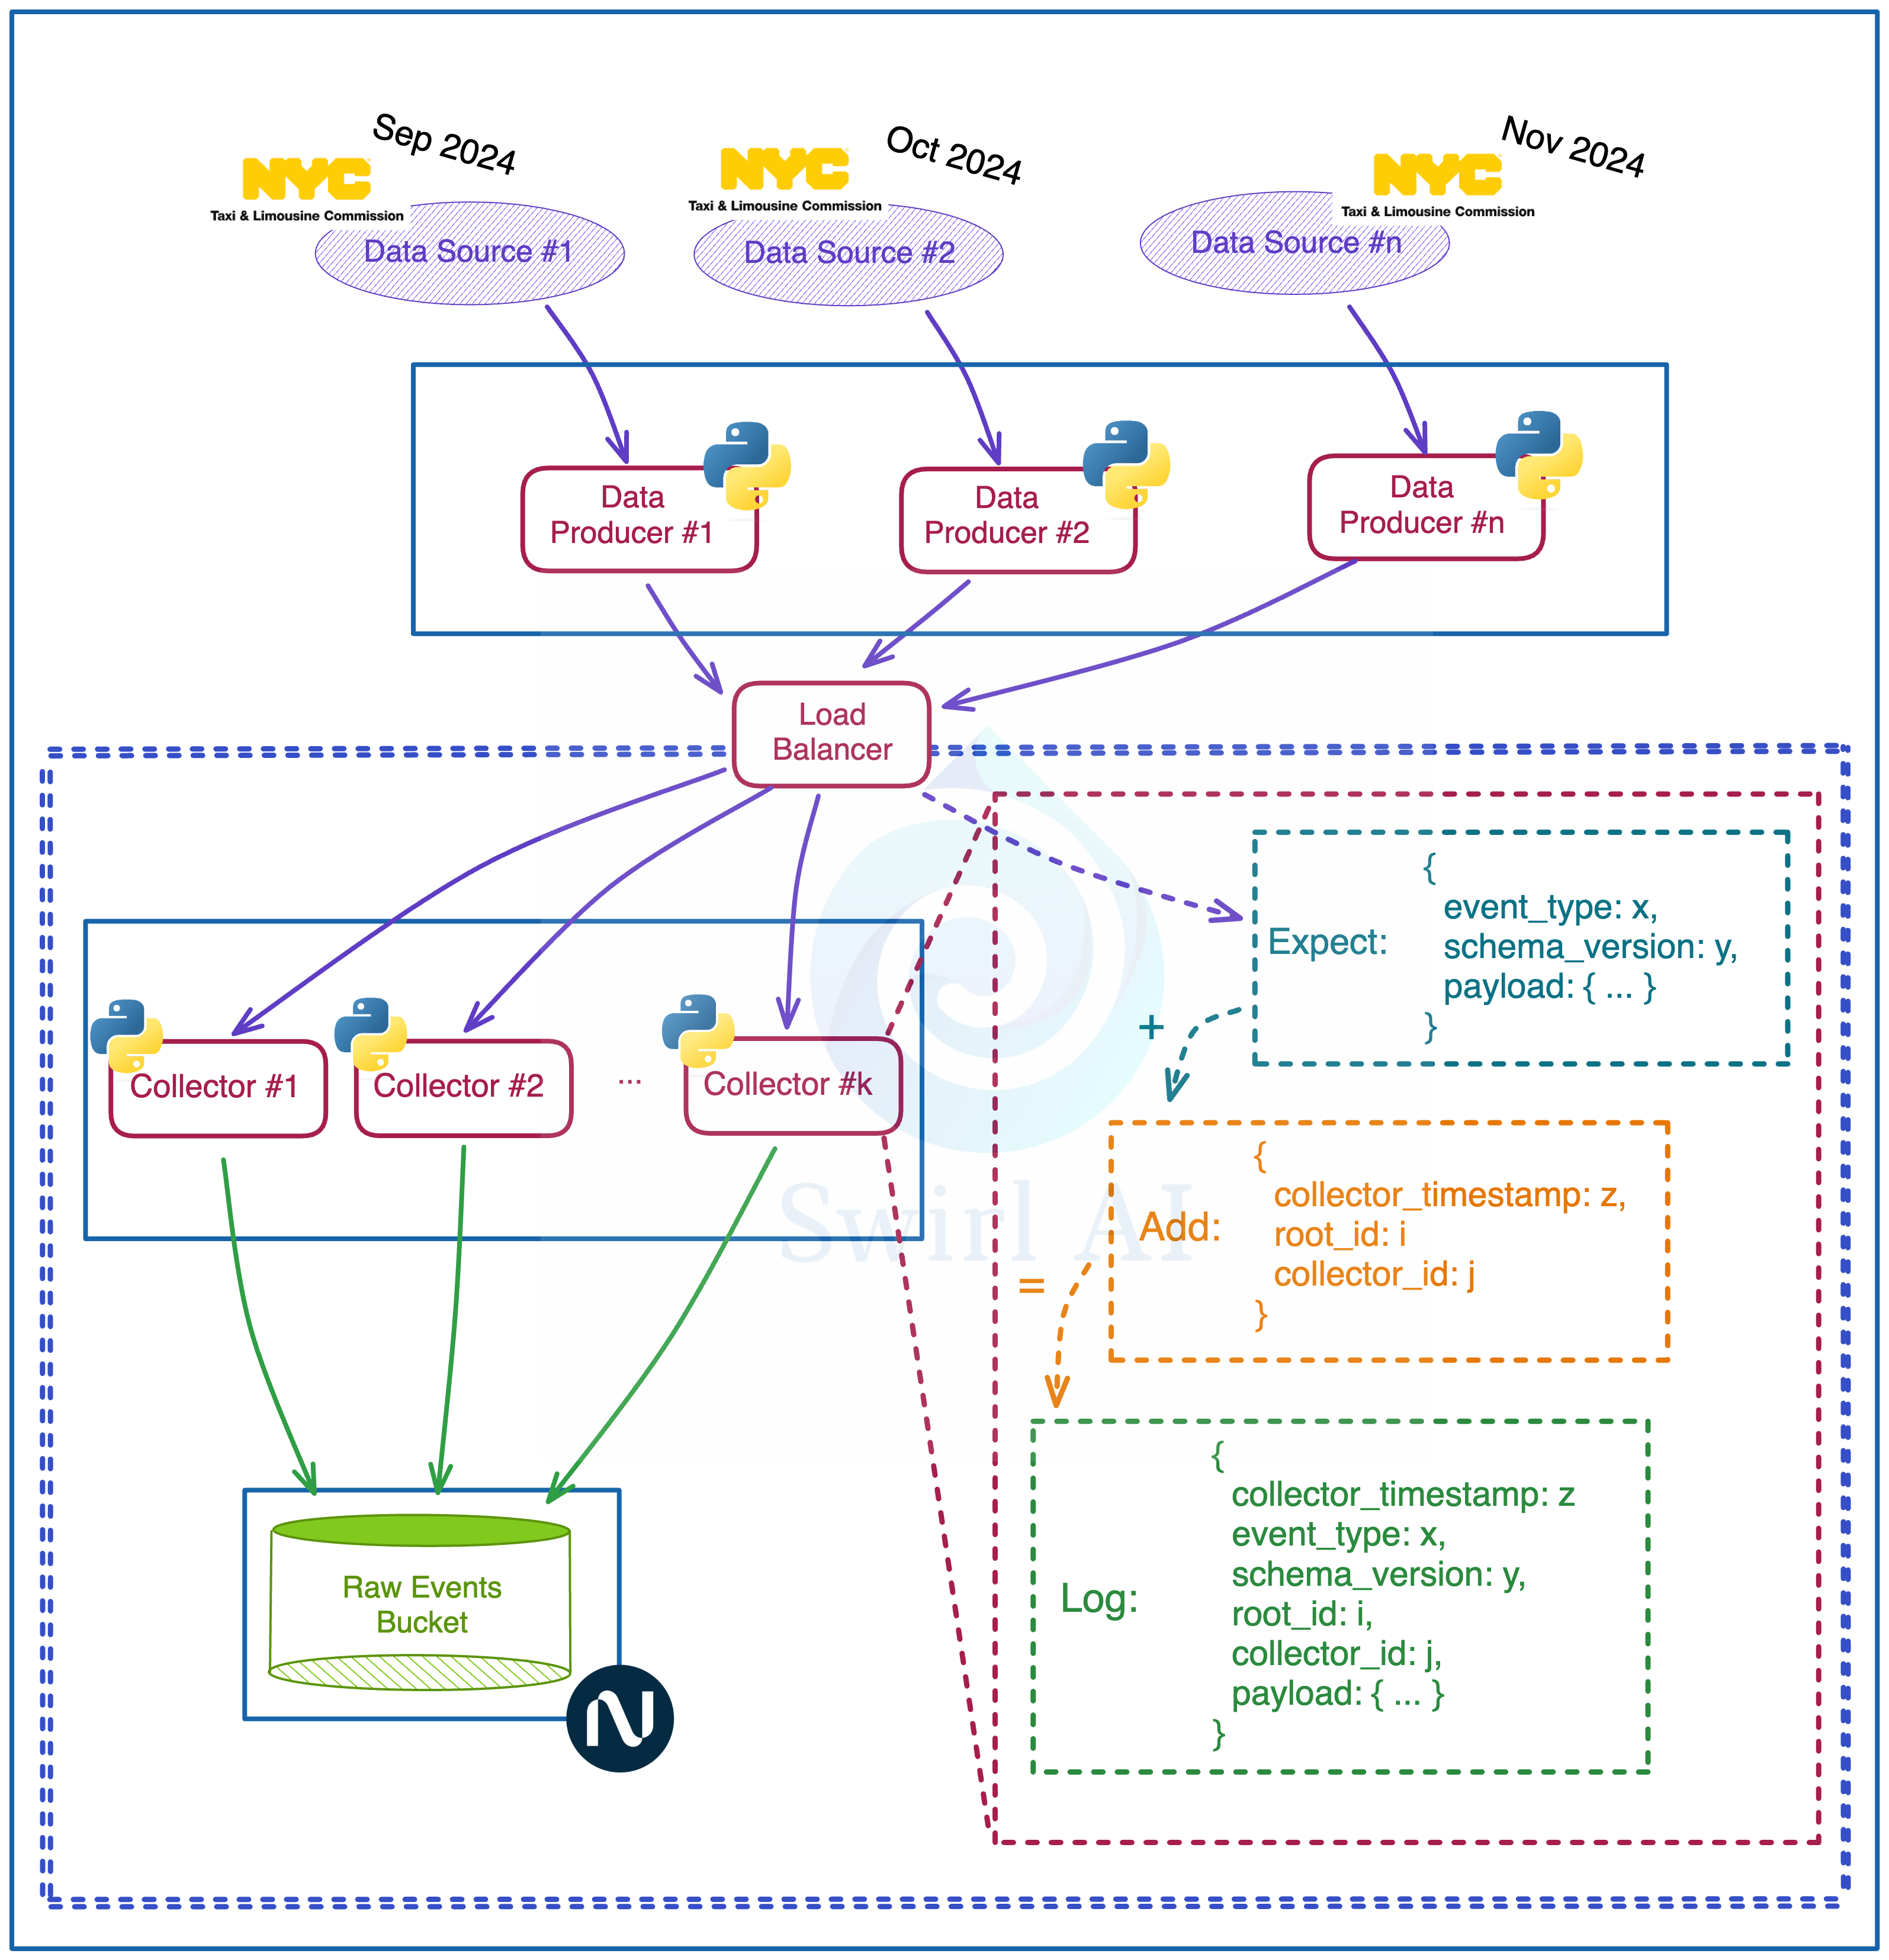
Collector will be a Highly Available REST API application implemented with FastAPI Framework.
Exposed REST API endpoints will be able to accept events that meet specific schema requirements - we will check for top level field existence. These top level fields will allow us to validate Data Contracts later on in the Downstream Processes.
Fields that we will be expecting during validation:
event_type - this will be needed to identify the source that generated the event.
schema_version - this field allows us to identify which version of the schema of the given data source is represented in the event. This data will be used for schema evolution.
payload - actual data of interest that is relevant for analytics purposes.
Collector application will add additional fields on top of the already existing ones:
collector_timestamp: timestamp when the collector has processed the event for downstream tasks.
root_id - a unique identifier for the event in the system (uuid).
collector_id - identifier of the collector process used for debugging purposes when there is the need to know where specifically the event was processed before emitting it to the downstream systems..
In this tutorial we will not use distributed messaging systems like Kafka and rather write batched events directly to Object Storage from the Collector.
We will face the Collector applications with a Load Balancer for High Availability purposes.
We will emulate the Data Producers by downloading batch datasets from the internet and emitting records of these datasets to the Collector applications one by one every n milliseconds/seconds.
We will use a popular TLC Trip Record Dataset available for download here.
To emulate distributed systems and multiple data sources we will download data for November of 2024 of both Yellow and Green taxi datasets and emit them in parallel using separate applications.
Collectors are the most sensitive part of your pipeline - you want to do as little processing and data manipulation here as possible. Usually, any errors here would result in permanent Data Loss (naturally less processing on the Data Producer side is also desirable as it would suffer from the same constraints). Once the data is already in the Downstream System you can always retry additional computation.
Hence, we decouple Collectors from any additional Schema Validation or Enrichment of the Payload and move that down the stream.
How does it all look from Kubernetes' perspective?
As mentioned earlier, our goal in this hands-on tutorial is to deploy everything on Nebius AI Cloud. The first set of applications will be deployed on Kubernetes
Collectors and Producers very naturally map to the Kubernetes resources:
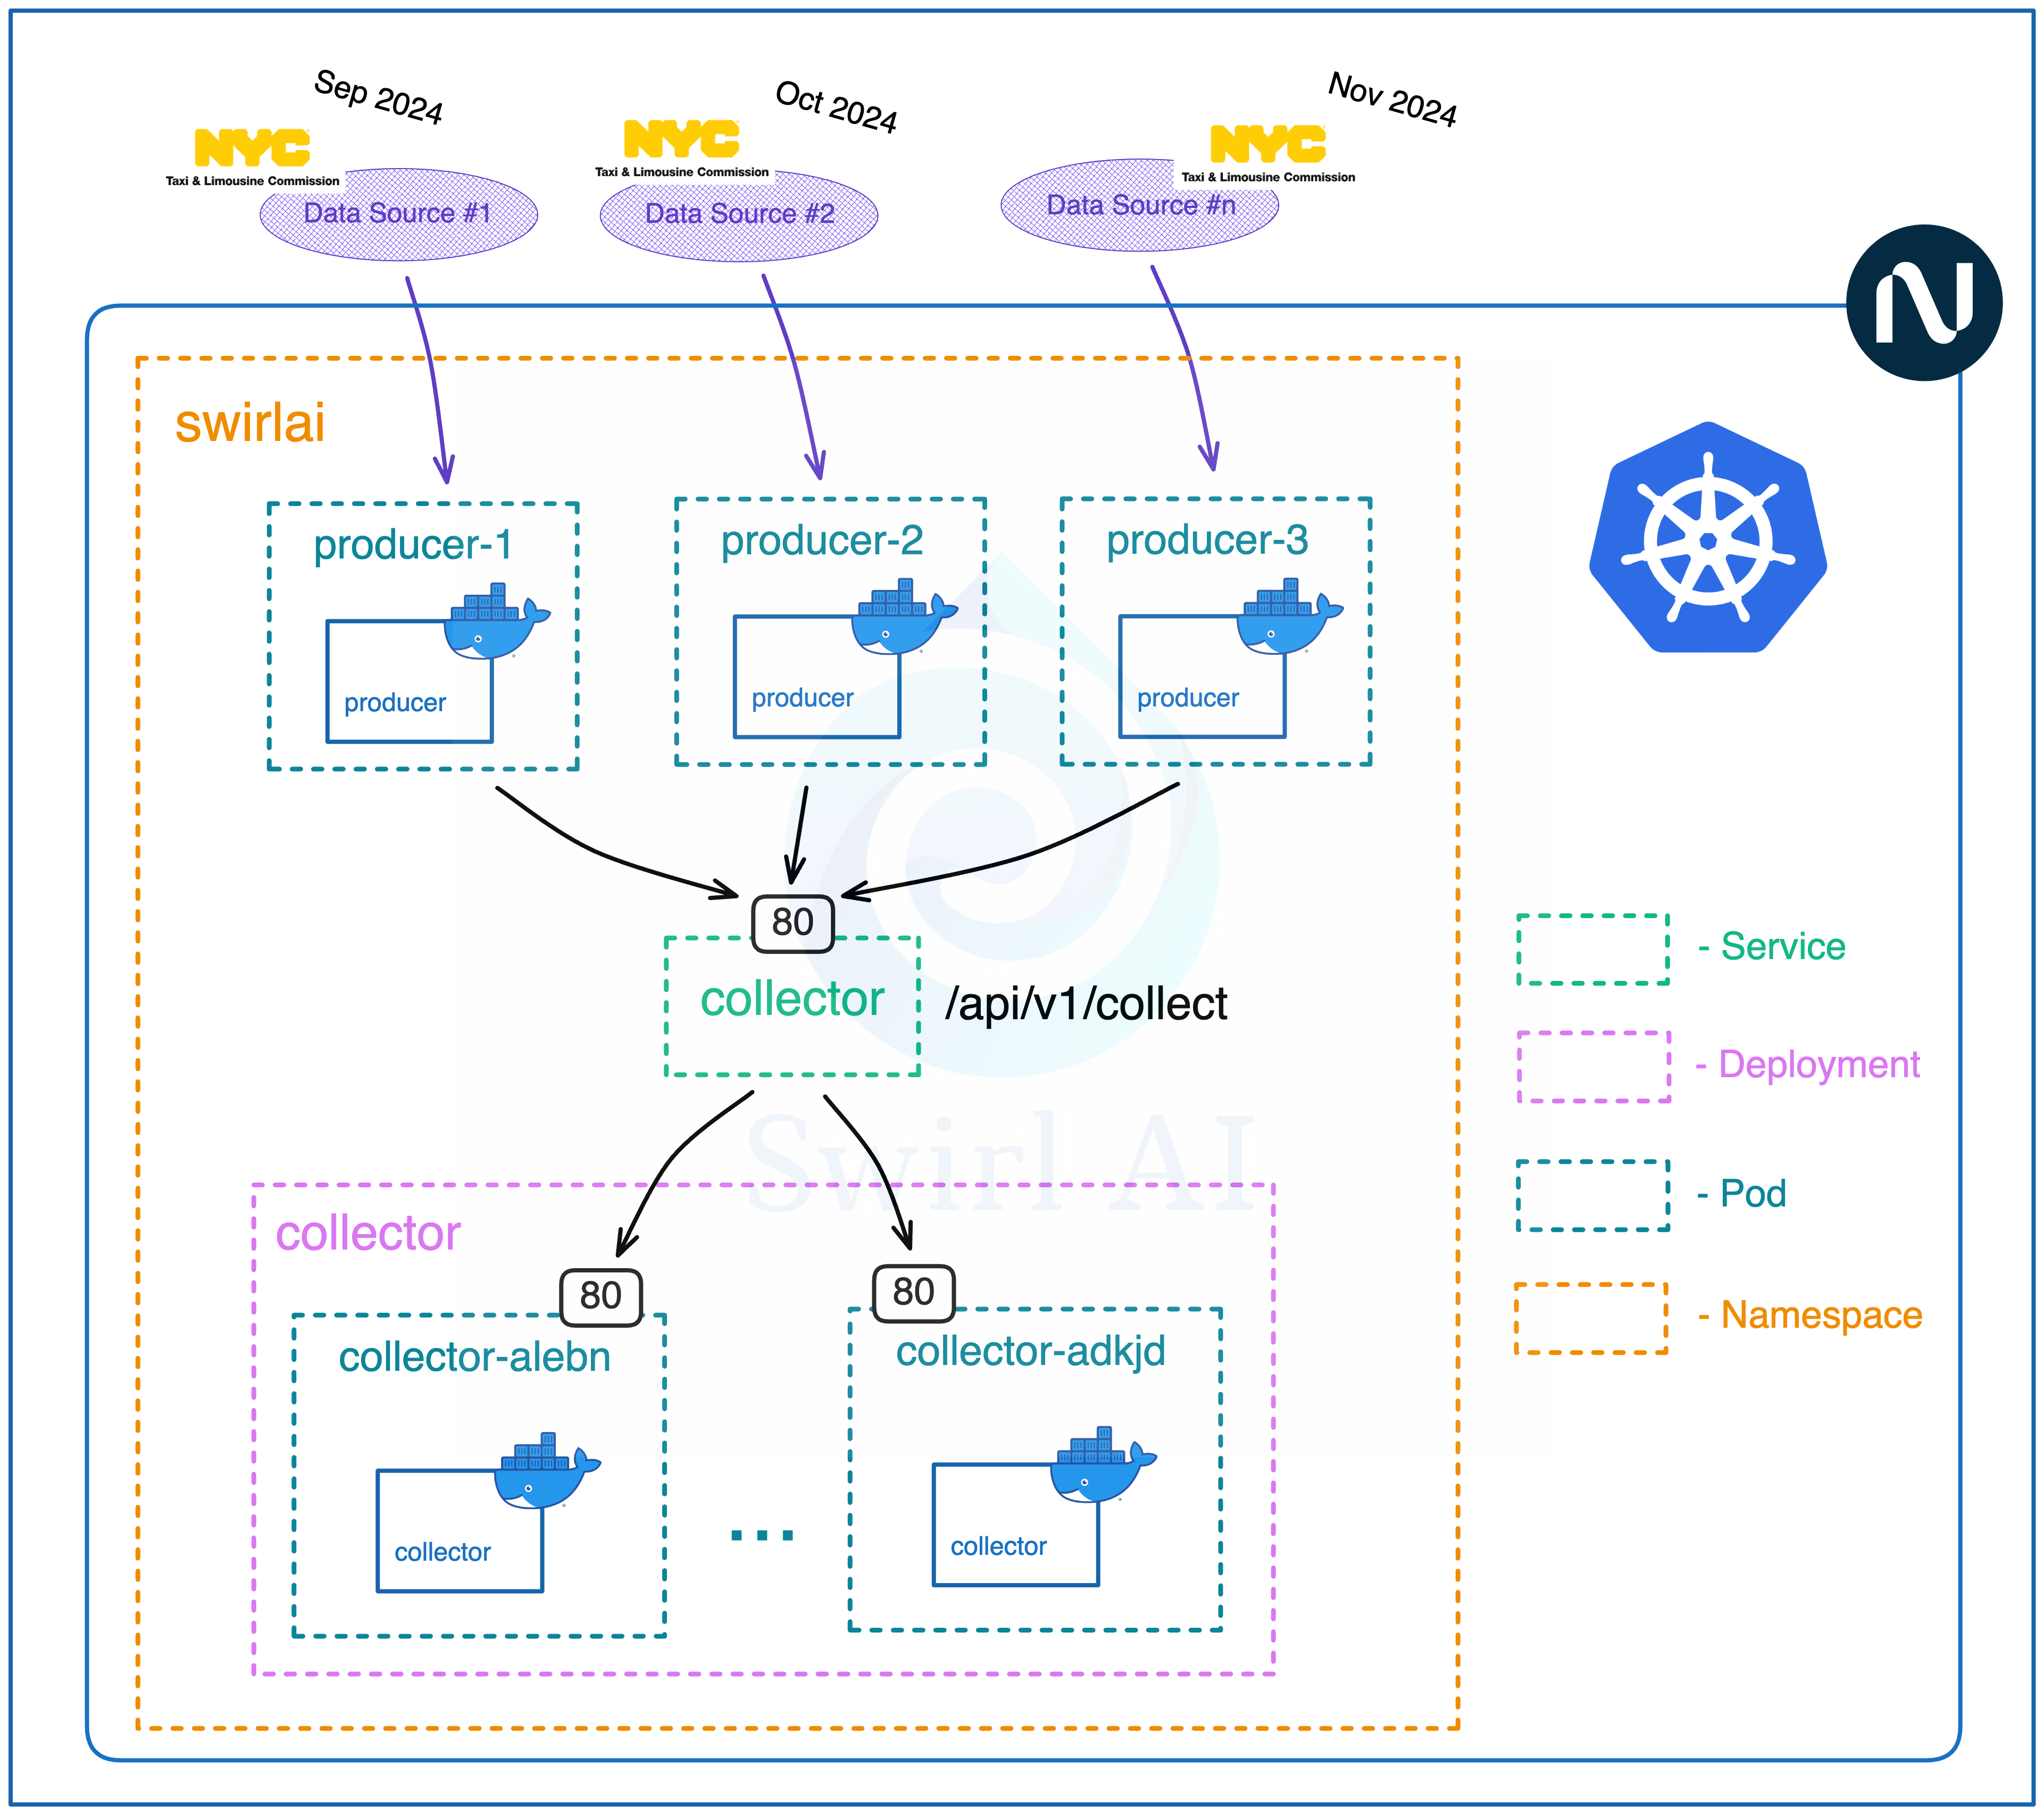
We will be deploying all applications in a single namespace called swirlai.
Collector applications will be in a form of deployment called collector.
We can scale replicas of the collector to as many as we will need.
We will mount a service named collector on top of the pods created by the collector deployment and map to the ports 80 of the containers managed by pods. The service itself will expose port 80.
Producer applications will be deployed in a form of separate pods per dataset. We will go for 2 pods named producer-1 and producer-2 that will download datasets for November of Grren Taxi and Yellow Taxi data respectively.
Since all applications will be deployed in the same namespace, we will be able to access service directly by its name collector.
We will be exposing the collection endpoint under path /api/v1/collect and accept post requests to it.
Eventually, we will be sending events to collector applications via post requests to the http://collector/api/v1/collect endpoint.
Implementing the Collector Application.
Reminder - you can find the code used in this Newsletter episode in one of my GitHub repositories here.
Before we can deploy anything, we will need a Kubernetes cluster, Object Storage and service account configured with Object Storage access.
Creating Kubernetes Cluster.
If you haven’t yet, create Nebius account here.
You can easily create Kubernetes clusters via Nebius UI.
Before you can start the deployment, you will need to install Nebius CLI tool. If you already have your account set up it should be straightforward.
Assuming that you are running on MacOS, run:
brew install jq
curl -LO "https://dl.k8s.io/release/$(curl -L -s https://dl.k8s.io/release/stable.txt)/bin/darwin/arm64/kubectl"
chmod +x ./kubectl
sudo mv ./kubectl /usr/local/bin/kubectl
sudo chown root: /usr/local/bin/kubectl
curl -sSL https://storage.ai.nebius.cloud/nebius/install.sh | bash
This will set you up with kubectl tool for communication with Kubernetes cluster and nebius CLI tool for authentication with. After this run:
nebius profile createIt will prompt you for:
Name - enter any.
Api endpoint - leave the default api.eu.nebius.cloud.
Authorisation type - choose federation.
After the above you will be redirected to the browser window where you will be authenticated. You now have your Nebius CLI tool set up.
If anything fails at this point, refer to official Nebius documentation here: Link.
For simplicity reasons, we will perform the deployment via the Nebius Cloud UI, here is how you can do it. It is easy to figure it out, but let’s run step-by-step so that there are no unanswered questions.
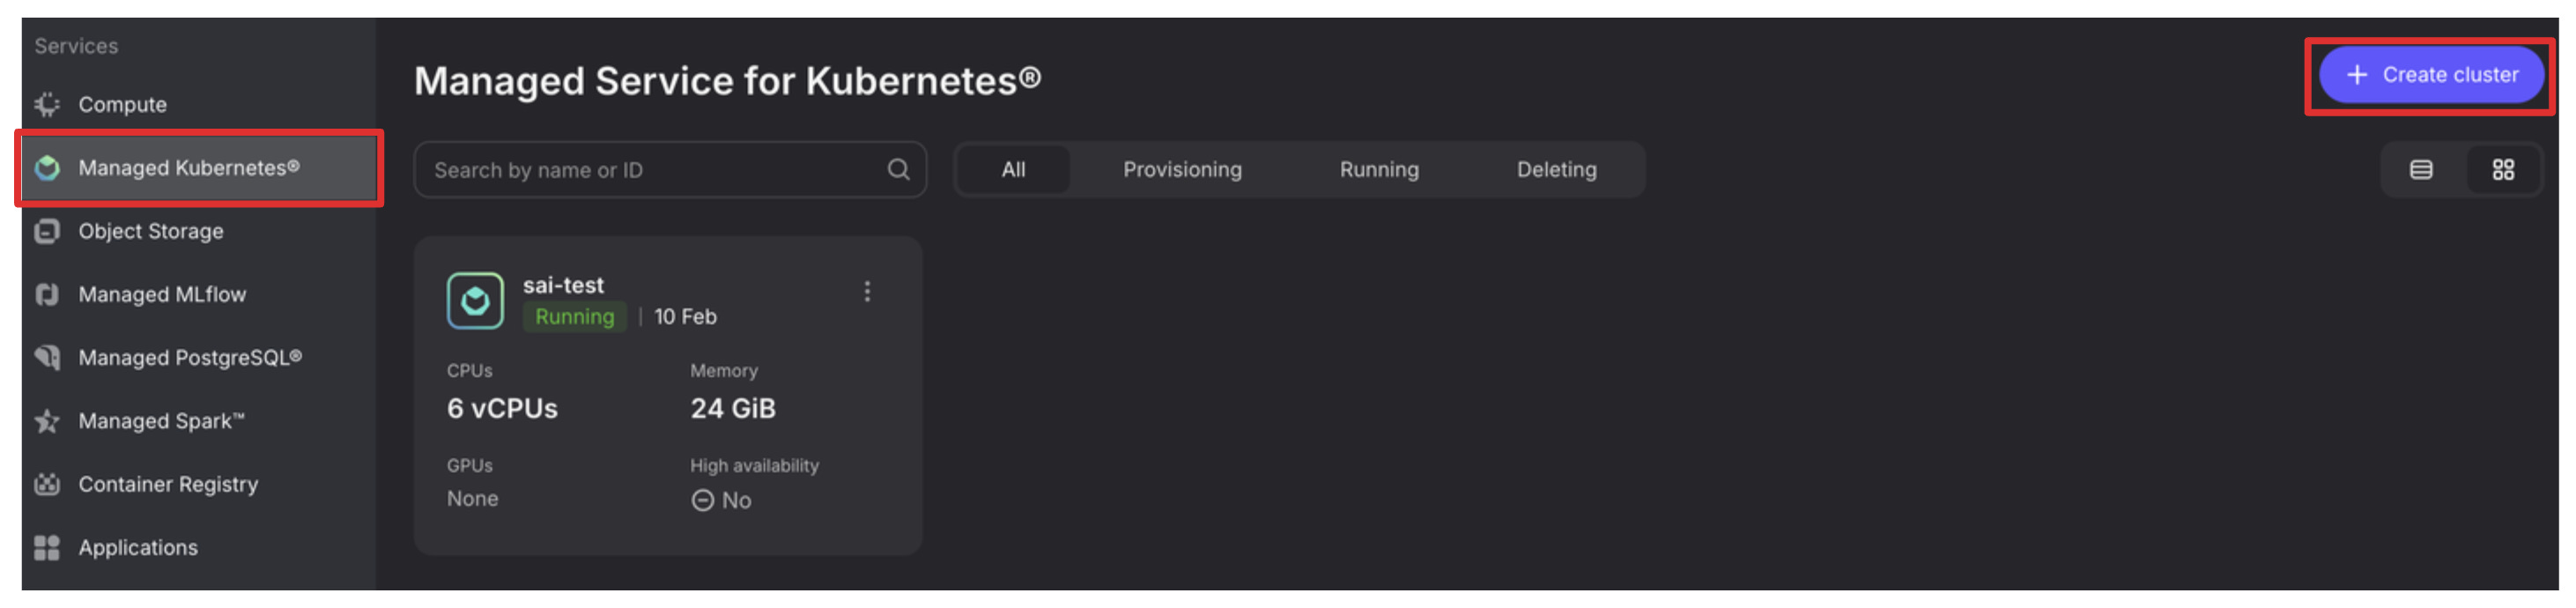
Once you log in to the console, click on the “Managed Kubernetes” tab on the left and click “+ Create cluster” top right
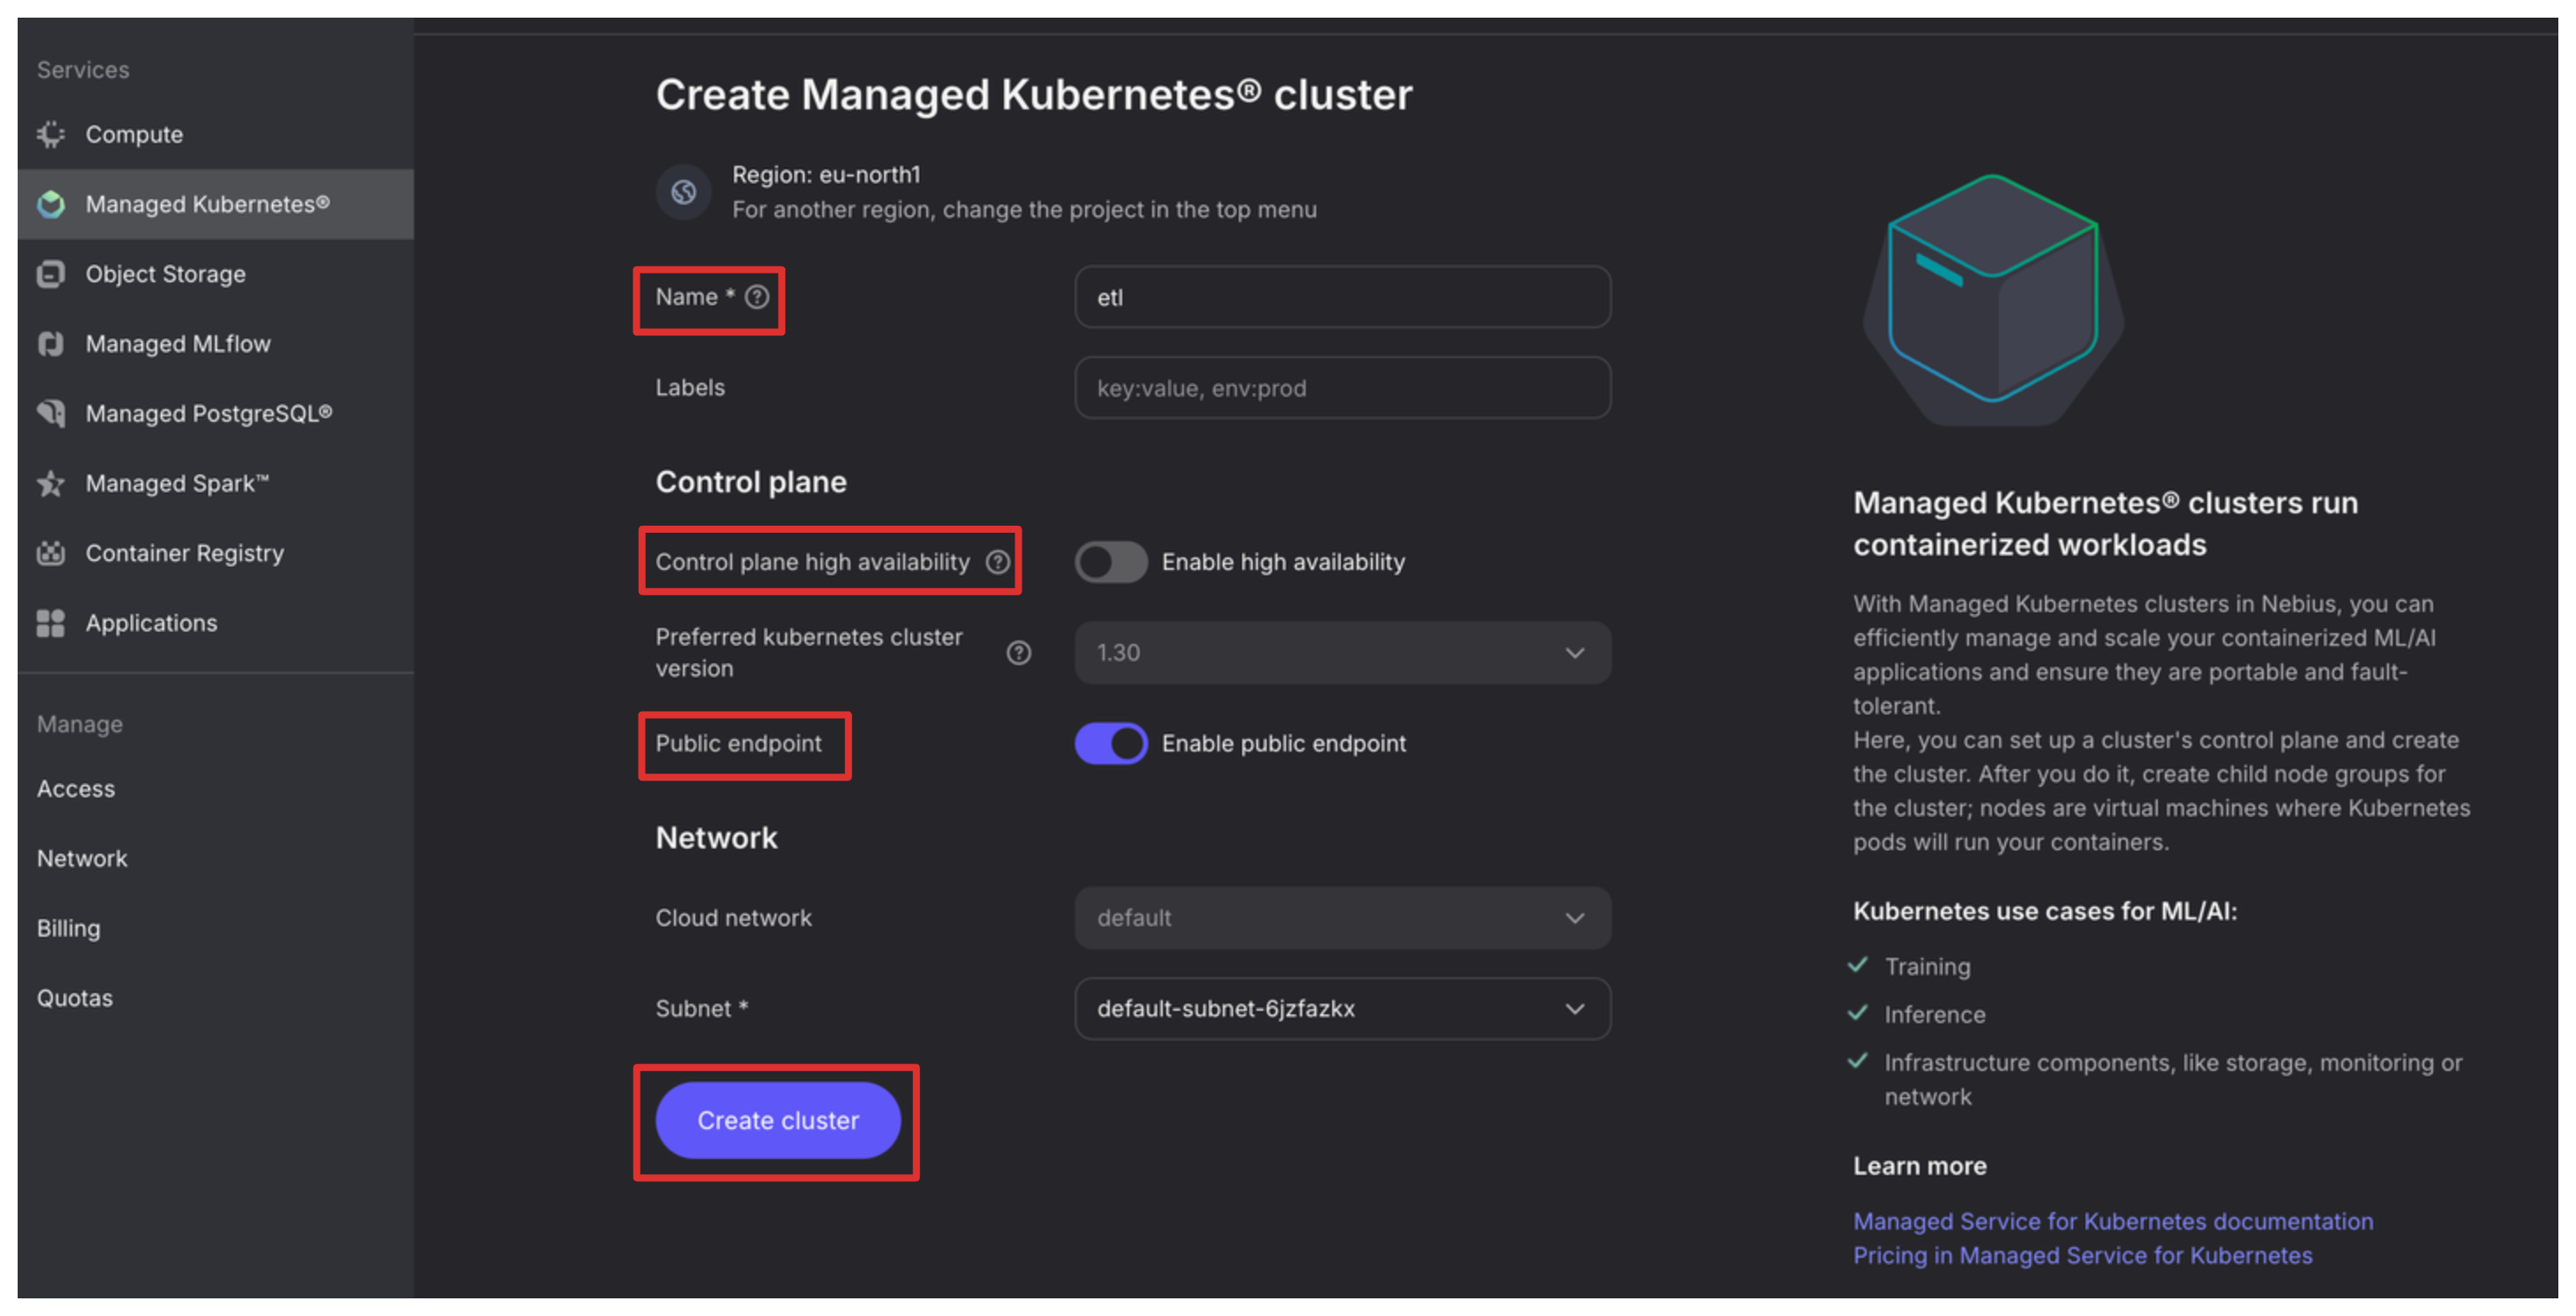
Once in the cluster creation section:
Provide the cluster name.
We switch off the Control plane high availability off as there is no need for it in a demo project, be sure to always have it turned on for production use cases.
Let’s have the Public endpoint on as it will make configuration of kubectl easier for this example.
Press “Create cluster” once configuration is complete.
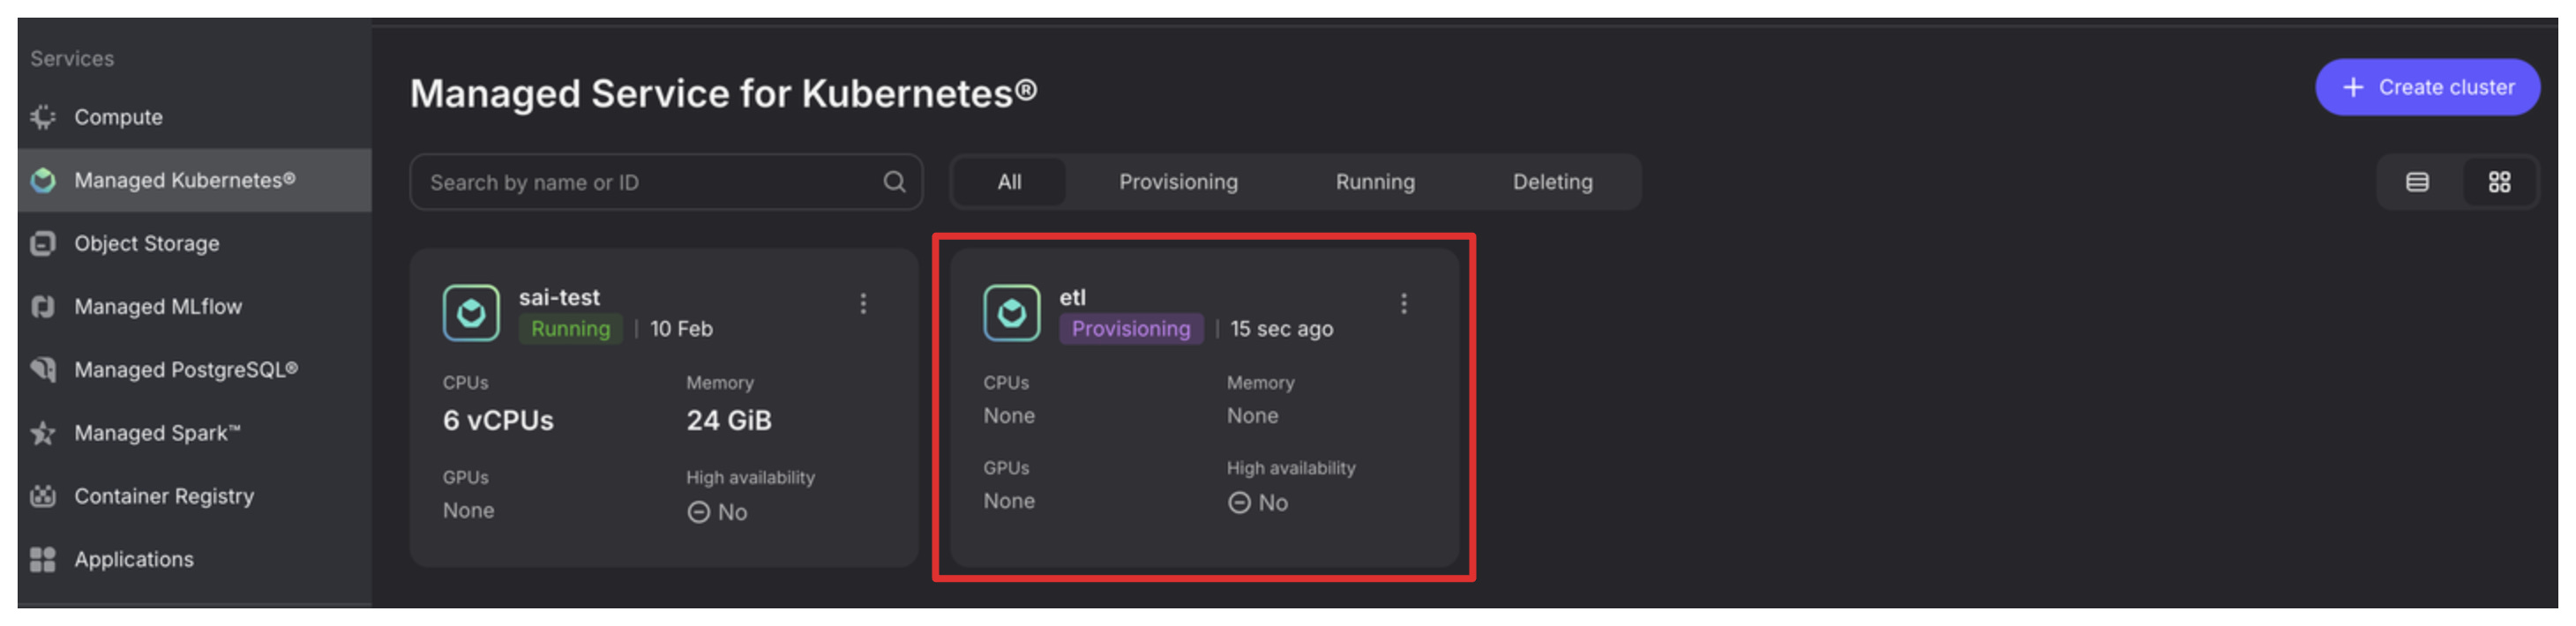
You will see a new cluster being provisioned in the “Managed Kubernetes” overview tab. Click on it.
The above steps have provisioned a control plane for K8s, now we need to add some worker nodes. Click on the “Node groups” tab and click “+ Create new group”.

Configure the Node Group for our project:
Give it a Name.
Disable the Public IPv4 address as we will be using LoadBalancer services to expose our apps, no need for the node itself to have a public address.
Keep Number of nodes at 3 as we will run cheap CPU based ones for multipple applications.
In the Preset field be sure to select 2 CPUs - 8 GiB RAM, we will not need more.

That’s it, we are ready to connect to our new Kubernetes cluster. Click on the “How to connect” button, copy the third command and run it. We are good to go to use kubectl and communicate with the cluster. Let’s try.
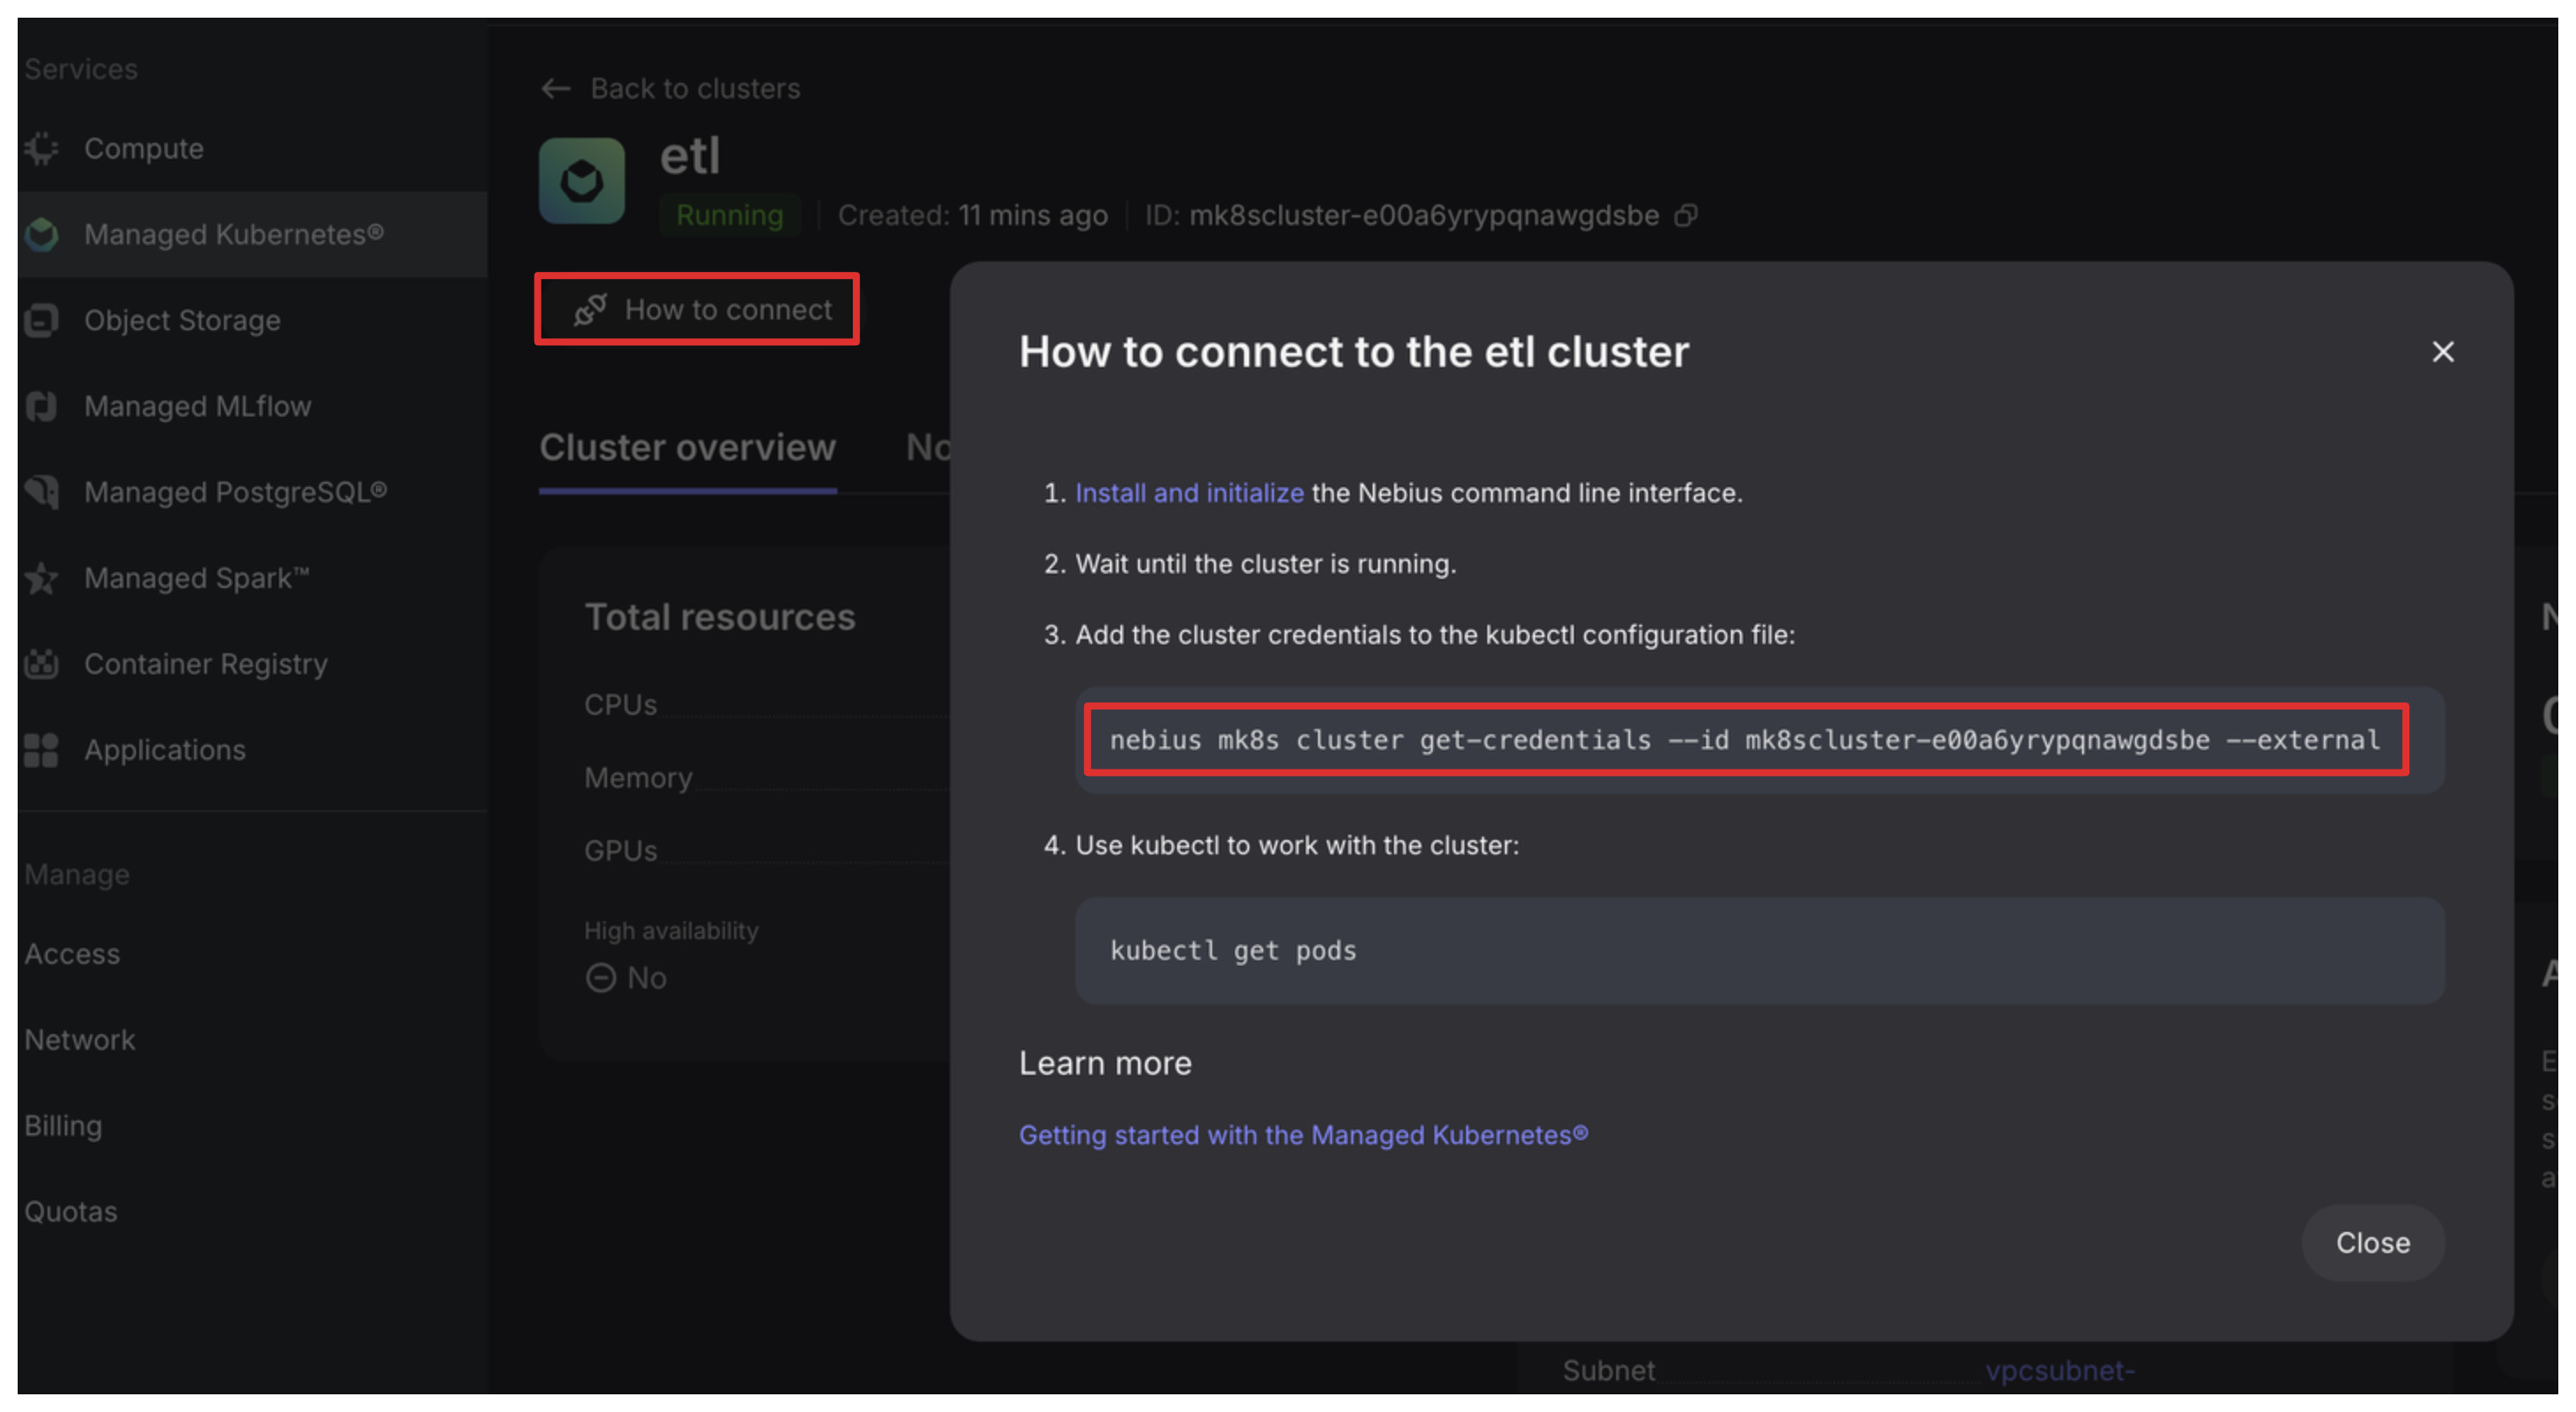
Run the following in the terminal
kubectl get podsyou should see empty list.
Creating Buckets.
For this tutorial, you will need 4 buckets to store the data.
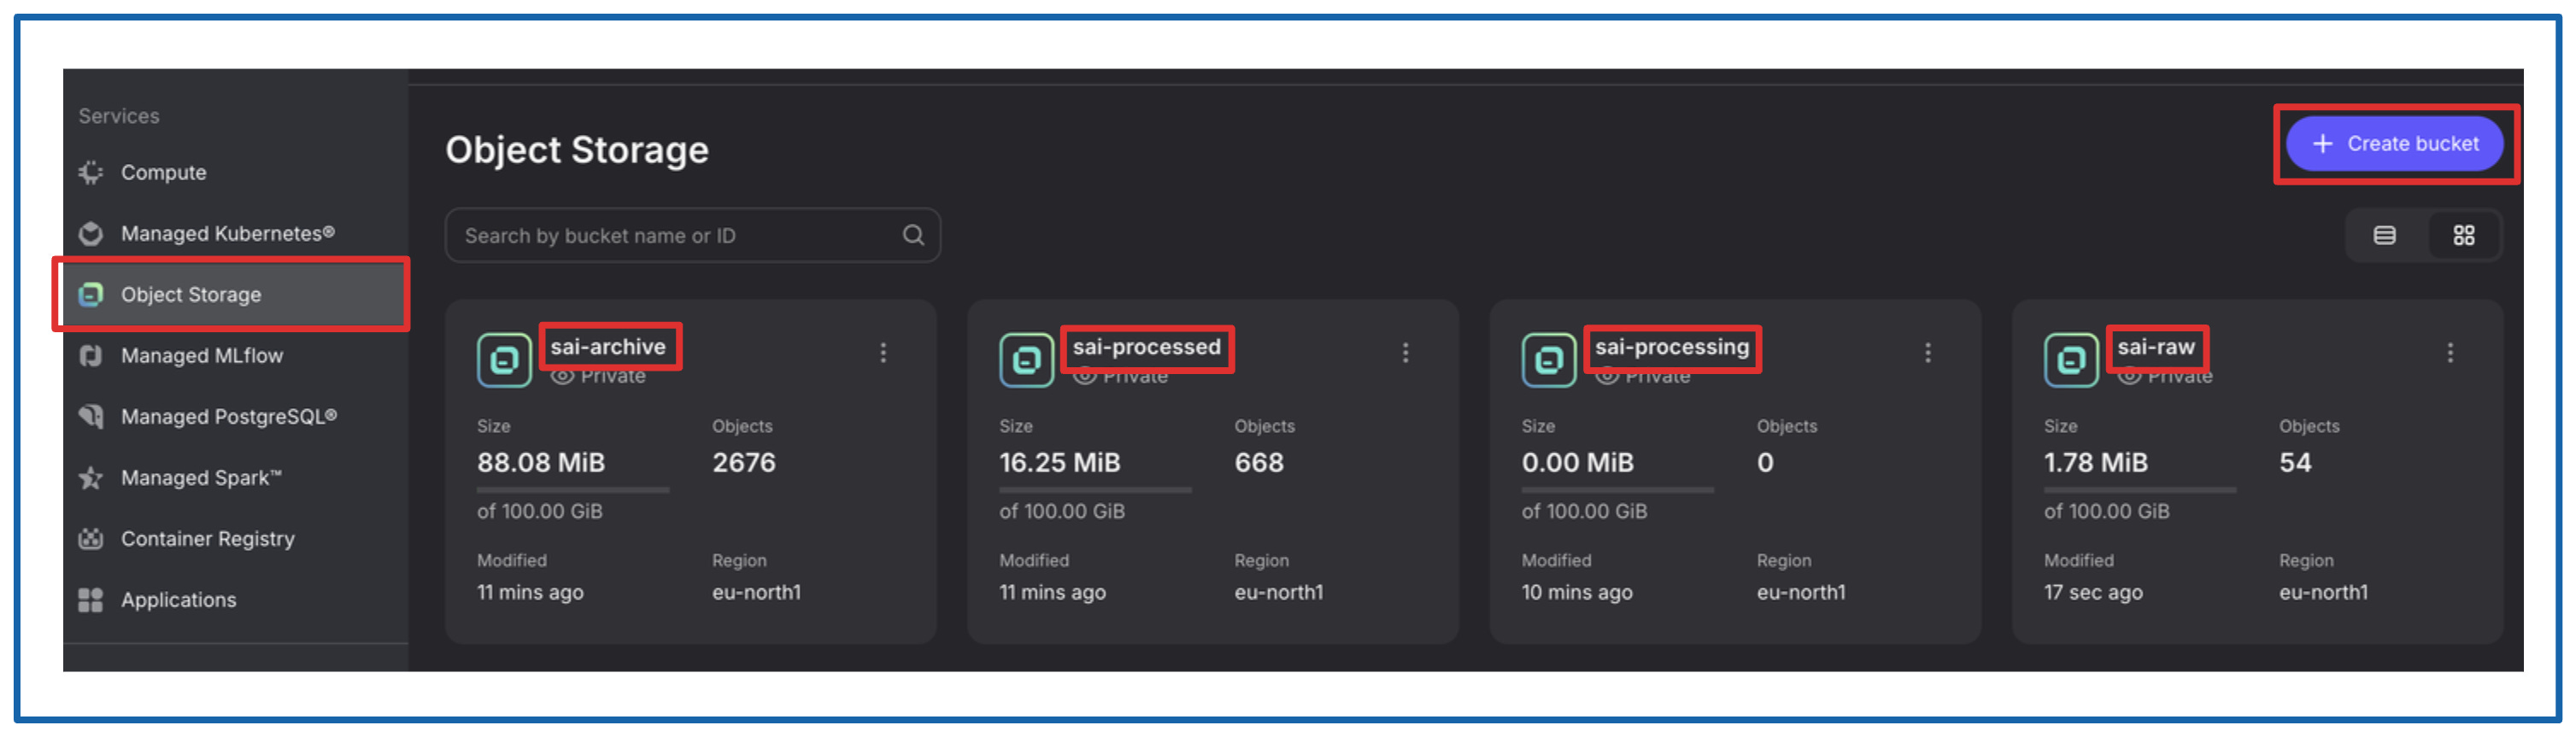
The creation of the buckets is trivial, you simply need to name them, the defaults for other configurations will do just fine. Feel free to replace sai- with your prefix just have in mind that you need to replace the names in two scripts down the line:
Collector application via deployment configuration.
 - name: RAW_LANDING_BUCKET
   value: sai-raw
Airflow DAG script.
RAW_LANDING_BUCKET = 'sai-raw'
RAW_PROCESSING_BUCKET = 'sai-processing'
PROCESSED_BUCKET = 'sai-processed'
ARCHIVE_BUCKET = 'sai-archive'
Creating Service Account.
I will not be able to explain it better than it is done here :) Just follow the instructions step by step.
[IMPORTANT]: We will need the following values from this procedure later, so be sure to save them:
NB_ACCESS_KEY_AWS_ID.
NB_SECRET_ACCESS_KEY.
AWS_DEFAULT_REGION: eu-north1.
AWS_ENDPOINT_URL: https://storage.eu-north1.nebius.cloud:443
I am assuming that you will be running the tutorial in eu-north1 region.
The Code.
Below is the screenshot of the structure of the Python code for the Collector application. Let’s dig deeper:
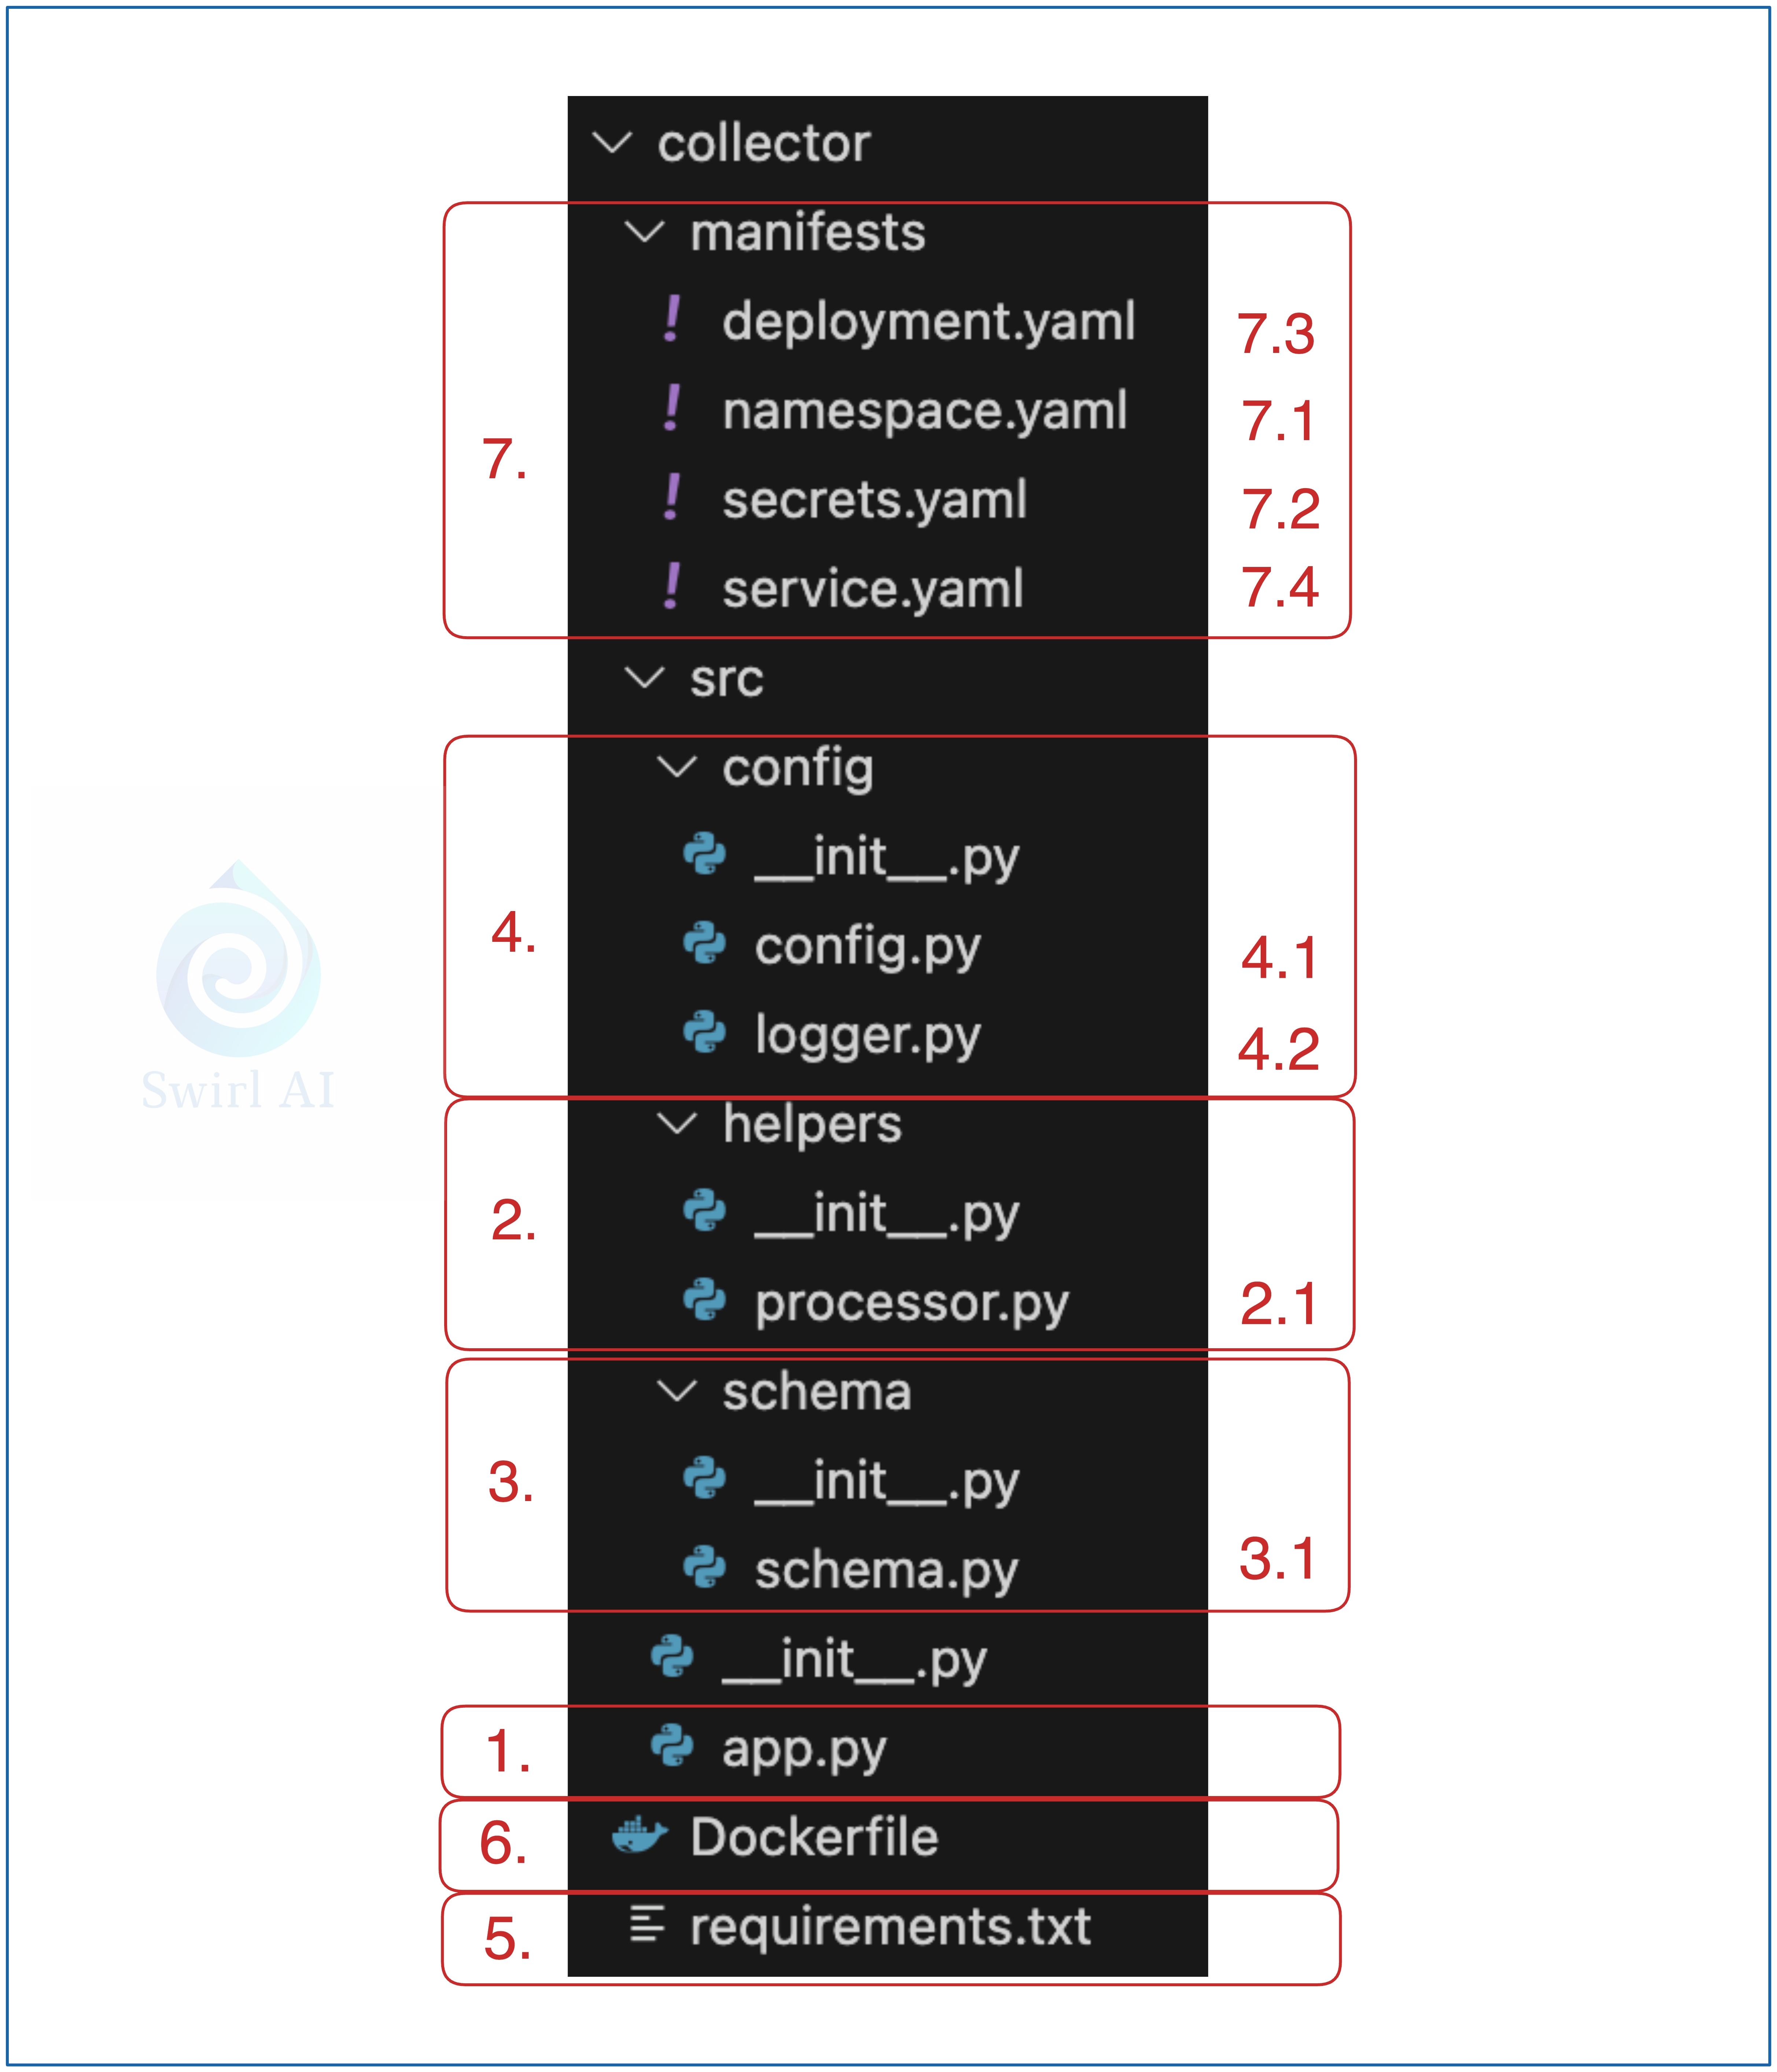
FastAPI Application entrypoint.
from fastapi import FastAPI
from schema.schema import TopLevelSchema
from helpers.processor import Processor, Buffer

import config.logger as logger
import config.config as config
import os


logger = logger.setup_logger()
conf = getattr(config, f'{os.environ["APP_ENV"].title()}Config')

app = FastAPI(docs_url=f"/api/{conf.V_API}/docs",
              redoc_url=f"/api/{conf.V_API}/redoc",
              openapi_url=f"/api/{conf.V_API}/openapi.json")

buffer = Buffer()

@app.get(f"/api/{conf.V_API}")
async def root():

    return {"message": f"Welcome to the collector {os.environ['HOSTNAME']}!"}


@app.post(f"/api/{conf.V_API}{conf.COLLECTOR_PATH}")
async def write_data(data: TopLevelSchema):

    try:
        processed_data = Processor(data.dict()).processed_event
        buffer.add(processed_data)
        logger.info(f"Adding event to buffer: {data.dict()}")
    except:
        logger.error(f"Failed to process event: {data}")

    return {"message": f"Event added to buffer"}
Take note that we are versioning the API endpoint as per
/api/{conf.V_API}It is an important good practice in REST API development as you might want to evolve the contract of it but keep the old version available for compatibility reasons. We store the version in configuration object.
As per
from helpers.processor import Processorwe are implementing all of the processing logic in a separate script located in helpers folder.
Any additional helper functions or Classes.
2.1. We implement processing logic that needs to be applied on the incoming events via Processor class. Buffer class contains logic of buffering the events and flushing them to the object storage after specific thresholds. We go simple for this example, when the buffer reaches 50 events, they get automatically flushed to object storage.
from datetime import datetime
import pytz
import uuid
import os
import json
import boto3


class Processor:

    def __init__(self, event: dict):

        self.event = event

    @staticmethod
    def process_event(event: dict) -> dict:

        def _add_timestamp(record: dict) -> dict:

            record['collector_tstamp'] = datetime.now(tz=pytz.UTC).strftime("%Y-%m-%d %H:%M:%S %z")

            return record

        def _add_id(record: dict) -> dict:

            record['root_id'] = str(uuid.uuid4())

            return record

        def _add_collector_id(record: dict) -> dict:

            record['collector_id'] = os.environ['HOSTNAME']

            return record

        processed_event = _add_timestamp(event)
        processed_event = _add_id(processed_event)
        processed_event = _add_collector_id(processed_event)

        return processed_event

    @property
    def processed_event(self) -> dict:

        return self.process_event(self.event)


class Buffer:

    BUFFER_SIZE = 50
    BUCKET_NAME = os.environ["RAW_LANDING_BUCKET"]

    def __init__(self):

        self.buffer = []
        self.s3 = boto3.client('s3')

    def add(self, event: dict):

        self.buffer.append(event)

        if len(self.buffer) >= self.BUFFER_SIZE:
            self.flush()

    def clear(self):

        self.buffer = []

    def flush(self):

        self.s3.put_object(
            Body=json.dumps(self.buffer),
            Bucket=self.BUCKET_NAME,
            Key=f'{datetime.now(tz=pytz.UTC).strftime("%Y-%m-%d-%H-%M-%S-%f")}.json'
        )

        self.clear()
As discussed while defining the architecture of the applications, the only processing is adding of 3 additional fields: collector_timestamp, root_id and collector_id.
Schema definition.
3.1. We want to decouple schema definition into a separate script from the main entrypoint of the FastAPI application for cleaner structure.
from pydantic import BaseModel


class TopLevelSchema(BaseModel):
    event_type: str
    schema_version: str
    payload: dict
It is really minimal pydantic data model. This is also where one of the main FastAPI advantages comes in. Any field defined in TopLevelSchema including the type is required and validated against any incoming event to the endpoint.
Referring back to app.py:
@app.post(f"/api/{conf.V_API}{conf.COLLECTOR_PATH}")
async def write_data(data: TopLevelSchema):
we are expecting data with schema TopLevelSchema for any data posted to /api/{conf.V_API}{conf.COLLECTOR_PATH} path (this will equal to /api/v1/collect in our example).
Additional application level configuration:
4.1. General application configuration.
class BaseConfig:

    COLLECTOR_PATH = "/collect"
    V_API = "v1"
    TESTING = False
    DEBUG = False


class DevConfig(BaseConfig):

    DEBUG = True


class ProdConfig(BaseConfig):

    ...


class TestConfig(BaseConfig):

    ...
This is also where we define a collection endpoint and current api version.
4.2. Logging configuration.
import logging
import os

LOG_FORMAT = f'[%(asctime)s]: {os.getpid()} %(levelname)s %(message)s'
DATE_FORMAT = '%Y-%m-%d %H:%M:%S'
HANDLERS = [logging.StreamHandler()]
LOG_LEVEL = logging.DEBUG


def setup_logger() -> logging.Logger:

    logging.basicConfig(level=LOG_LEVEL,
                        format=LOG_FORMAT,
                        datefmt=DATE_FORMAT,
                        handlers=HANDLERS)

    return logging.getLogger()
This holds some global logging configuration that you can also parametrise according to your environment.
Python library requirements.
fastapi~=0.95.1
pydantic~=1.10.7
uvicorn
pytz
boto3
As you can see, for this example the requirements are extremely minimal as we are not doing any fancy processing inside of the collector and rather treating it as a proxy.
Dockerfile for the application container.
FROM python:3.9

WORKDIR /code/src

COPY ./requirements.txt /code/requirements.txt

RUN pip install --no-cache-dir --upgrade -r /code/requirements.txt

COPY ./src /code/src

CMD ["uvicorn", "app:app", "--host", "0.0.0.0", "--port", "80"]
The Dockerfile is also very minimal for now.
Important:
This is not a production ready Dockerfile as there are many security considerations you should do (we will look into how to build a secure docker container in one of the future Newsletter episodes). For simplicity sake we will not implement them today.
In order to build the container that contains your collector application, go to the folder where Dockerfile resides and run, we will be pushing the container to your docker hub registry, so you will need to change some values in the bellow command:
docker build . --platform linux/amd64 -t <docker_hub_account>/<repository>:<tag>Once the container is built, push it to your docker registry so that it can be pulled to the K8s cluster:
docker push <docker_hub_account>/<repository>:<tag>If you want to just follow the tutorial, feel free to use the image I’ve built, the latest one can be found under:
aurimasg/collector:0.2.0Kubernetes resource manifests that will be needed to deploy Collector application.
7.1. Namespace.
apiVersion: v1
kind: Namespace
metadata:
   name: swirlai
You can create the namespace by running:
kubectl apply -f namespace.yaml7.2. Secrets.
Remember when we created
NB_ACCESS_KEY_AWS_ID.
NB_SECRET_ACCESS_KEY.
these are equivalent to AWS_ACCESS_KEY_ID and AWS_SECRET_ACCESS_KEY respectively. You will need to base64 encode them and add the values to the secrets file.
apiVersion: v1
kind: Secret
metadata:
  name: aws-secret
  namespace: swirlai
type: Opaque
data:
  AWS_ACCESS_KEY_ID: <base64 encoded value of AWS_ACCESS_KEY_ID>
  AWS_SECRET_ACCESS_KEY: <base64 encoded value of AWS_SECRET_ACCESS_KEY>
7.3. Deployment.
apiVersion: apps/v1
kind: Deployment
metadata:
  name: collector
  labels:
    app: collector
  namespace: swirlai
spec:
  replicas: 2
  selector:
    matchLabels:
      app: collector
  template:
    metadata:
      labels:
        app: collector
    spec:
      containers:
      - name: collector
        image: aurimasg/collector:0.2.0
        imagePullPolicy: Always
        ports:
        - containerPort: 80
        env:
          - name: APP_ENV
            value: Dev
          - name: RAW_LANDING_BUCKET
            value: sai-raw
          - name: AWS_ACCESS_KEY_ID
            valueFrom:
              secretKeyRef:
                name: aws-secret
                key: AWS_ACCESS_KEY_ID
          - name: AWS_SECRET_ACCESS_KEY
            valueFrom:
              secretKeyRef:
                name: aws-secret
                key: AWS_SECRET_ACCESS_KEY
          - name: AWS_DEFAULT_REGION
            value: eu-north1
          - name: AWS_ENDPOINT_URL
            value: https://storage.eu-north1.nebius.cloud:443
You can create the deployment by running:
kubectl apply -f deployment.yaml7.4. Service.
apiVersion: v1
kind: Service
metadata:
  name: collector
  namespace: swirlai
spec:
  selector:
    app: collector
  ports:
  - name: collector
    protocol: TCP
    port: 80
    targetPort: 80
You can create the service by running:
kubectl apply -f service.yamlThat’s it for collector, it should be successfully running in the swirlai namespace:
kubectl get pods -n swirlaiImplementing the Producer Applications.
We will not spend much time on Producer application as it is really simple, it just downloads data from the internet and pushes it to the collector service.
Below is the screenshot of the structure of the Python project for the Producer application.
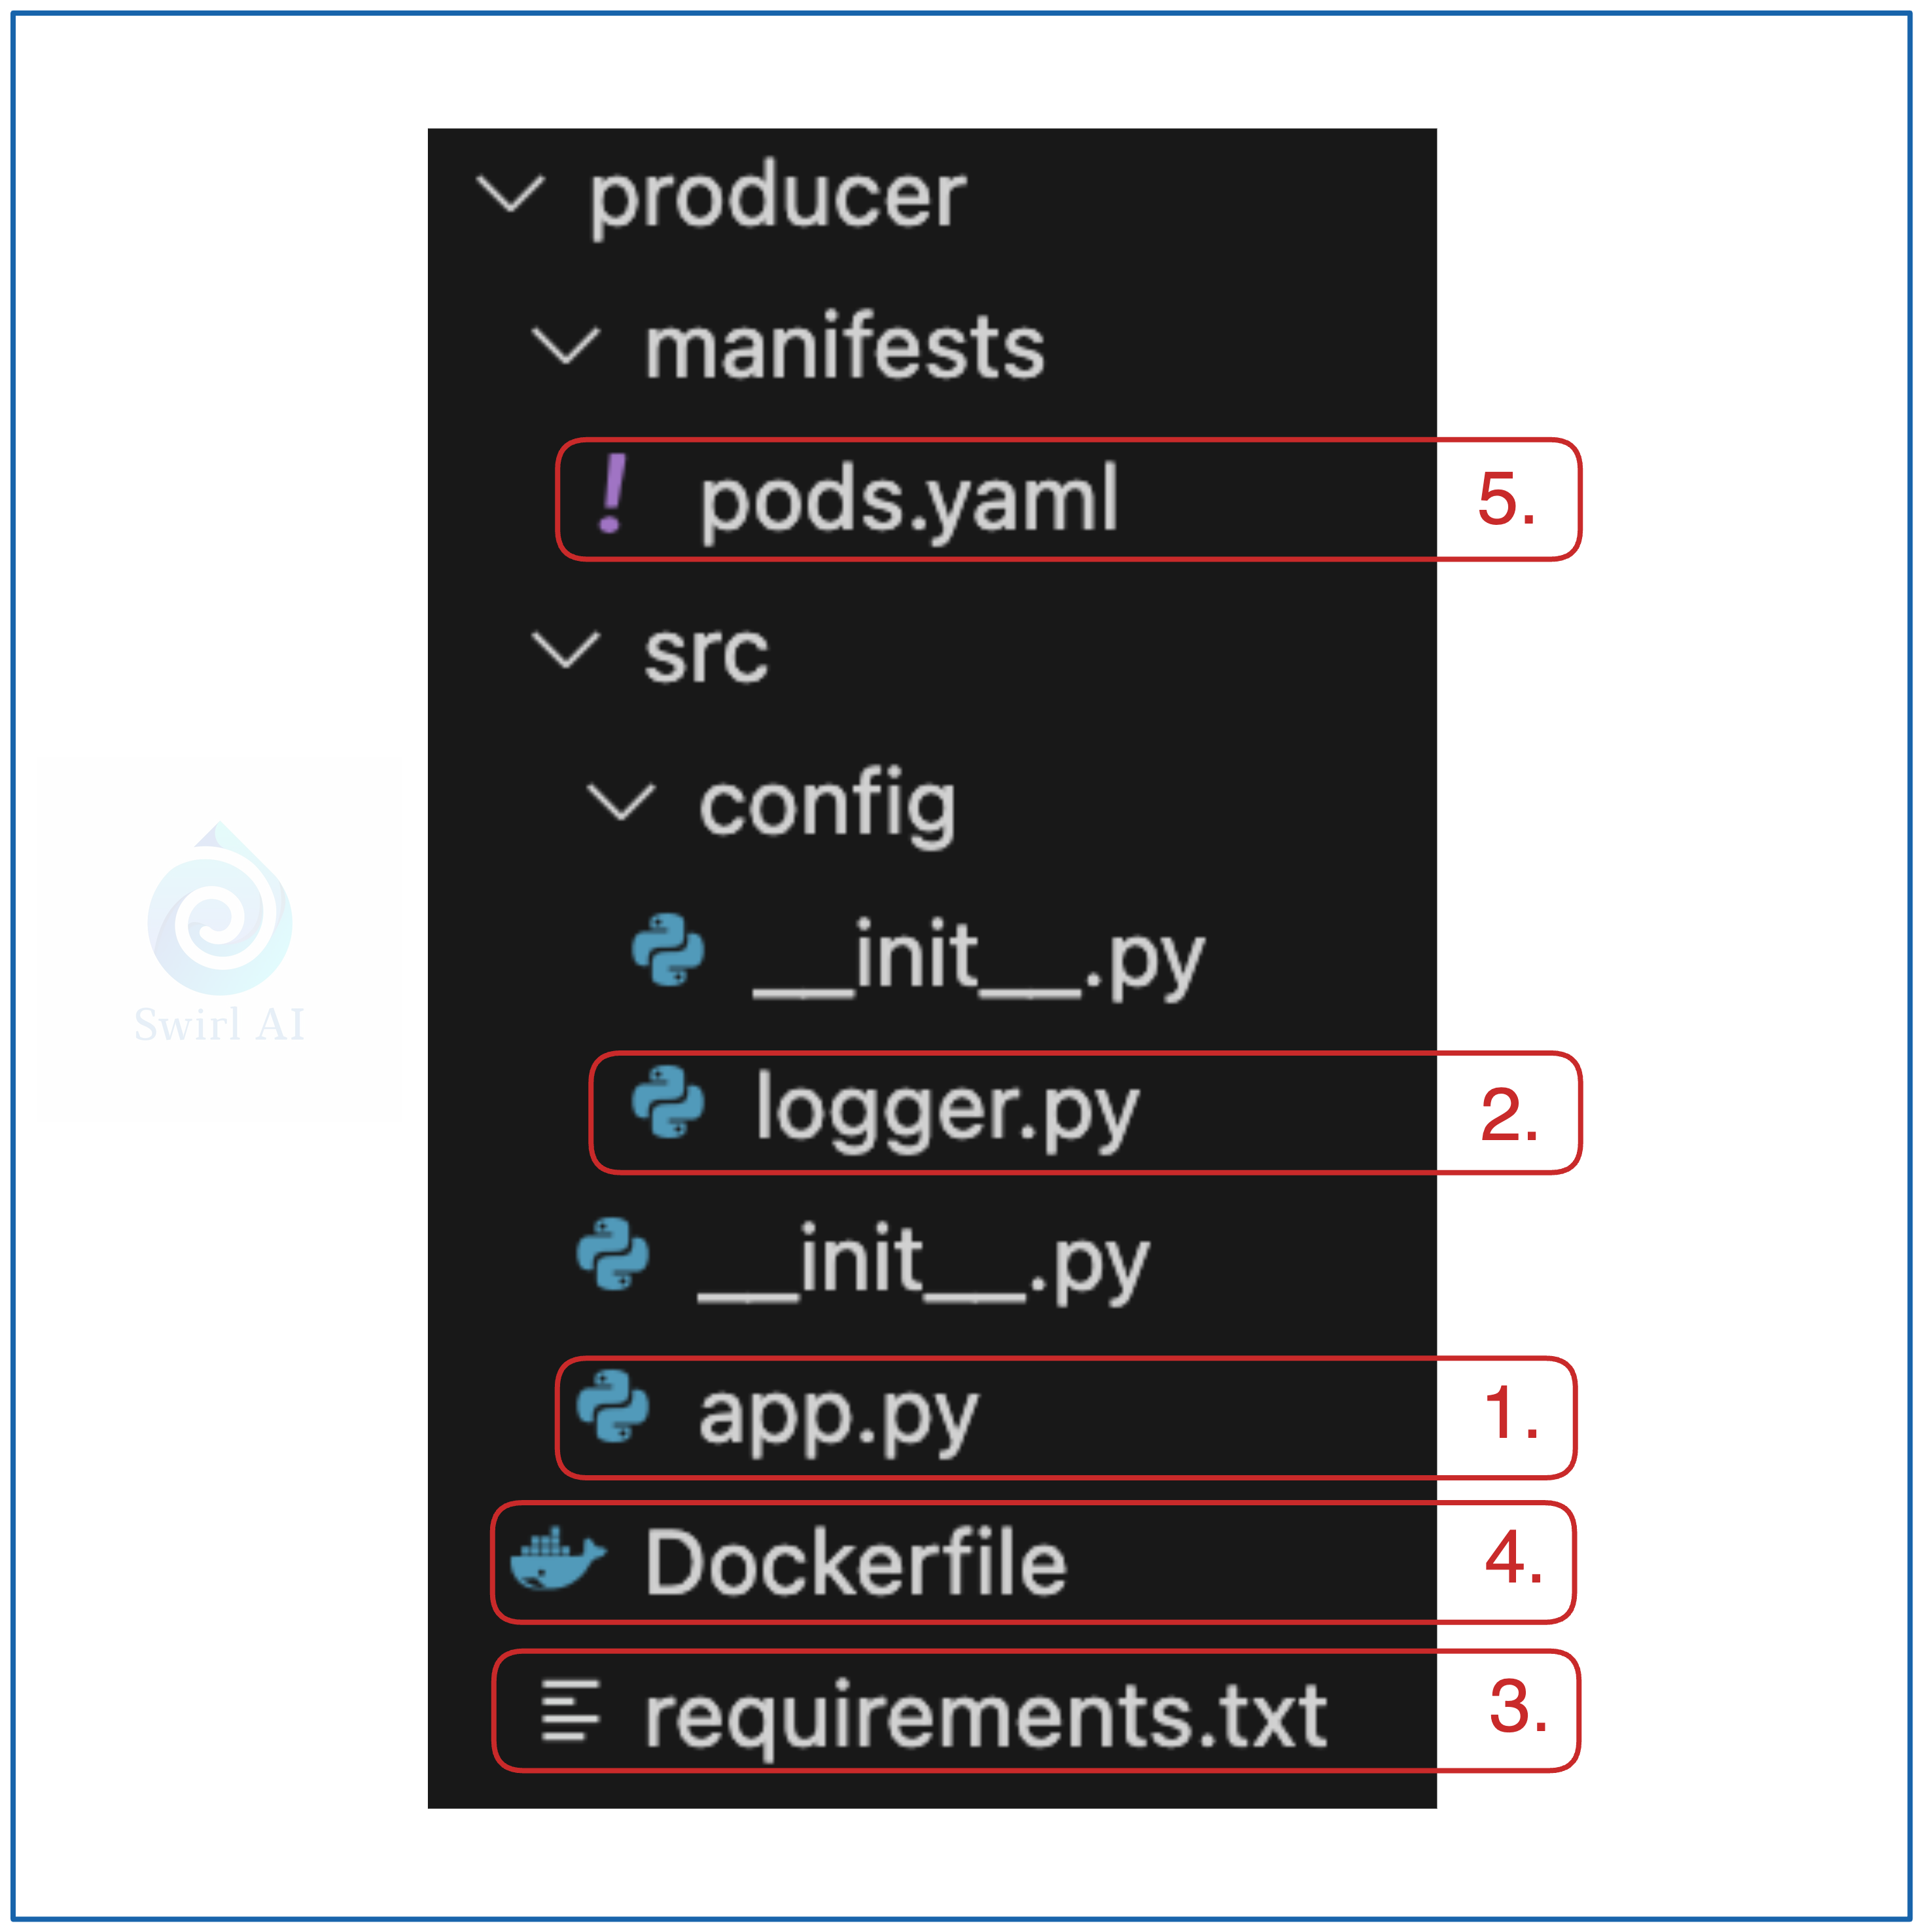
The entrypoint of the application.
import requests
import pandas as pd
import time
import config.logger as logger
import argparse
import os
import json


SOURCE_URL = os.environ['DATA_URL']
EVENT_TYPE = os.environ['EVENT_TYPE']
SCHEMA_VERSION = os.environ['SCHEMA_VERSION']
COLLECTOR_URL = os.environ['COLLECTOR_URL']

logger = logger.setup_logger()


def main(sleep_time: float, max_record_count: int) -> None:

    df = pd.read_parquet(SOURCE_URL)

    if max_record_count == 0:
        max_record_count = len(df)

    record_counter = 0

    top_level_fields = {'event_type': EVENT_TYPE,
                        'schema_version': SCHEMA_VERSION}

    for index, row in df.iterrows():

        try:
            json_header = {'Content-Type': 'application/json'}
            url = COLLECTOR_URL
            row_data = row.to_dict()
            if EVENT_TYPE == 'YellowTaxiTripRecords':
                row_data['tpep_pickup_datetime'] = row_data['tpep_pickup_datetime'].strftime('%Y-%m-%d %H:%M:%S')
                row_data['tpep_dropoff_datetime'] = row_data['tpep_dropoff_datetime'].strftime('%Y-%m-%d %H:%M:%S')
            else:
                row_data['lpep_pickup_datetime'] = row_data['lpep_pickup_datetime'].strftime('%Y-%m-%d %H:%M:%S')
                row_data['lpep_dropoff_datetime'] = row_data['lpep_dropoff_datetime'].strftime('%Y-%m-%d %H:%M:%S')
            processed_event = {**top_level_fields, "payload": row_data}
            logger.info(requests.post(url, data=json.dumps(processed_event), headers=json_header))
        except:
            logger.error(f'Failed to process payload')

        record_counter += 1
        time.sleep(sleep_time)

        if record_counter >= max_record_count:
            break


if __name__ == "__main__":

    parser = argparse.ArgumentParser(description="Runs producer which writes TLCTripRecordData to collector endpoint")
    parser.add_argument('-s', '--sleep_time', required=False, default='0.5')
    parser.add_argument('-m', '--max_record_count', required=False, default='10000')
    args = parser.parse_args()

    logger.info(f'Starting sample producer (TLCTripRecordData) with {args.sleep_time} s between sending records')

    main(float(args.sleep_time), int(args.max_record_count))
Note the
SOURCE_URL = os.environ['DATA_URL']
EVENT_TYPE = os.environ['EVENT_TYPE']
SCHEMA_VERSION = os.environ['SCHEMA_VERSION']
COLLECTOR_URL = os.environ['COLLECTOR_URL']

<...>

df = pd.read_parquet(SOURCE_URL)
We will be passing location to the NYS cab datasets together with other configurations via environmental variables which we will configure when creating Pods in Kubernetes.
Logger options that are the same as in the Collector application.
import logging
import os

LOG_FORMAT = f'[%(asctime)s]: {os.getpid()} %(levelname)s %(message)s'
DATE_FORMAT = '%Y-%m-%d %H:%M:%S'
HANDLERS = [logging.StreamHandler()]
LOG_LEVEL = logging.DEBUG


def setup_logger() -> logging.Logger:

    logging.basicConfig(level=LOG_LEVEL,
                        format=LOG_FORMAT,
                        datefmt=DATE_FORMAT,
                        handlers=HANDLERS)

    return logging.getLogger()
Python requirements for the environment.
pandas
pyarrow
requests
Dockerfile for building the application container.
FROM python:3.9

WORKDIR /code/src

COPY ./requirements.txt /code/requirements.txt

RUN pip install --no-cache-dir --upgrade -r /code/requirements.txt

COPY ./src /code/src

CMD ["python", "app.py"]
Kubernetes Pod definition manifest.
apiVersion: v1
kind: Pod
metadata:
  name: producer-1
  namespace: swirlai
spec:
  containers:
  - name: producer
    image: aurimasg/producer-yt:0.2.0
    imagePullPolicy: Always
    env:
    - name: DATA_URL
      value: https://d37ci6vzurychx.cloudfront.net/trip-data/yellow_tripdata_2024-11.parquet
    - name: EVENT_TYPE
      value: YellowTaxiTripRecords
    - name: SCHEMA_VERSION
      value: 0-1-0
    - name: COLLECTOR_URL
      value: http://collector/api/v1/collect

---

apiVersion: v1
kind: Pod
metadata:
  name: producer-2
  namespace: swirlai
spec:
  containers:
  - name: producer
    image: aurimasg/producer-yt:0.2.0
    imagePullPolicy: Always
    env:
    - name: DATA_URL
      value: https://d37ci6vzurychx.cloudfront.net/trip-data/green_tripdata_2024-11.parquet
    - name: EVENT_TYPE
      value: GreenTaxiTripRecords
    - name: SCHEMA_VERSION
      value: 0-1-0
    - name: COLLECTOR_URL
      value: http://collector/api/v1/collect
Note that we pass location to the data to be downloaded via an environment variable. You can create the pods by running:
kubectl apply -f pods.yamlImplementing Spark ETL.
We will implement the entire ETL in a single Airflow DAG. The code will also live in a single script for simplicity case.
So the data now continuously lands in the sai-raw bucket, each of the file is a json file with 50 batched records.
The first thing we will want to do is move all of the accumulated data into the sai-processing bucket. Why?
We will be reading the data with Spark and it needs a static set of files for processing. Remember, sai-raw is continuously updated with new data.
We want to fix the ETL batch and timestamp so that something unexpected happens it is always possible to reprocess.
We will read the json files in sai-processing bucket with Spark, expand json payloads into structured data and split all of the data into datasets and their versions accordingly.
Once Spark processing is completed, we will move the data that is being processed into an archive bucket.
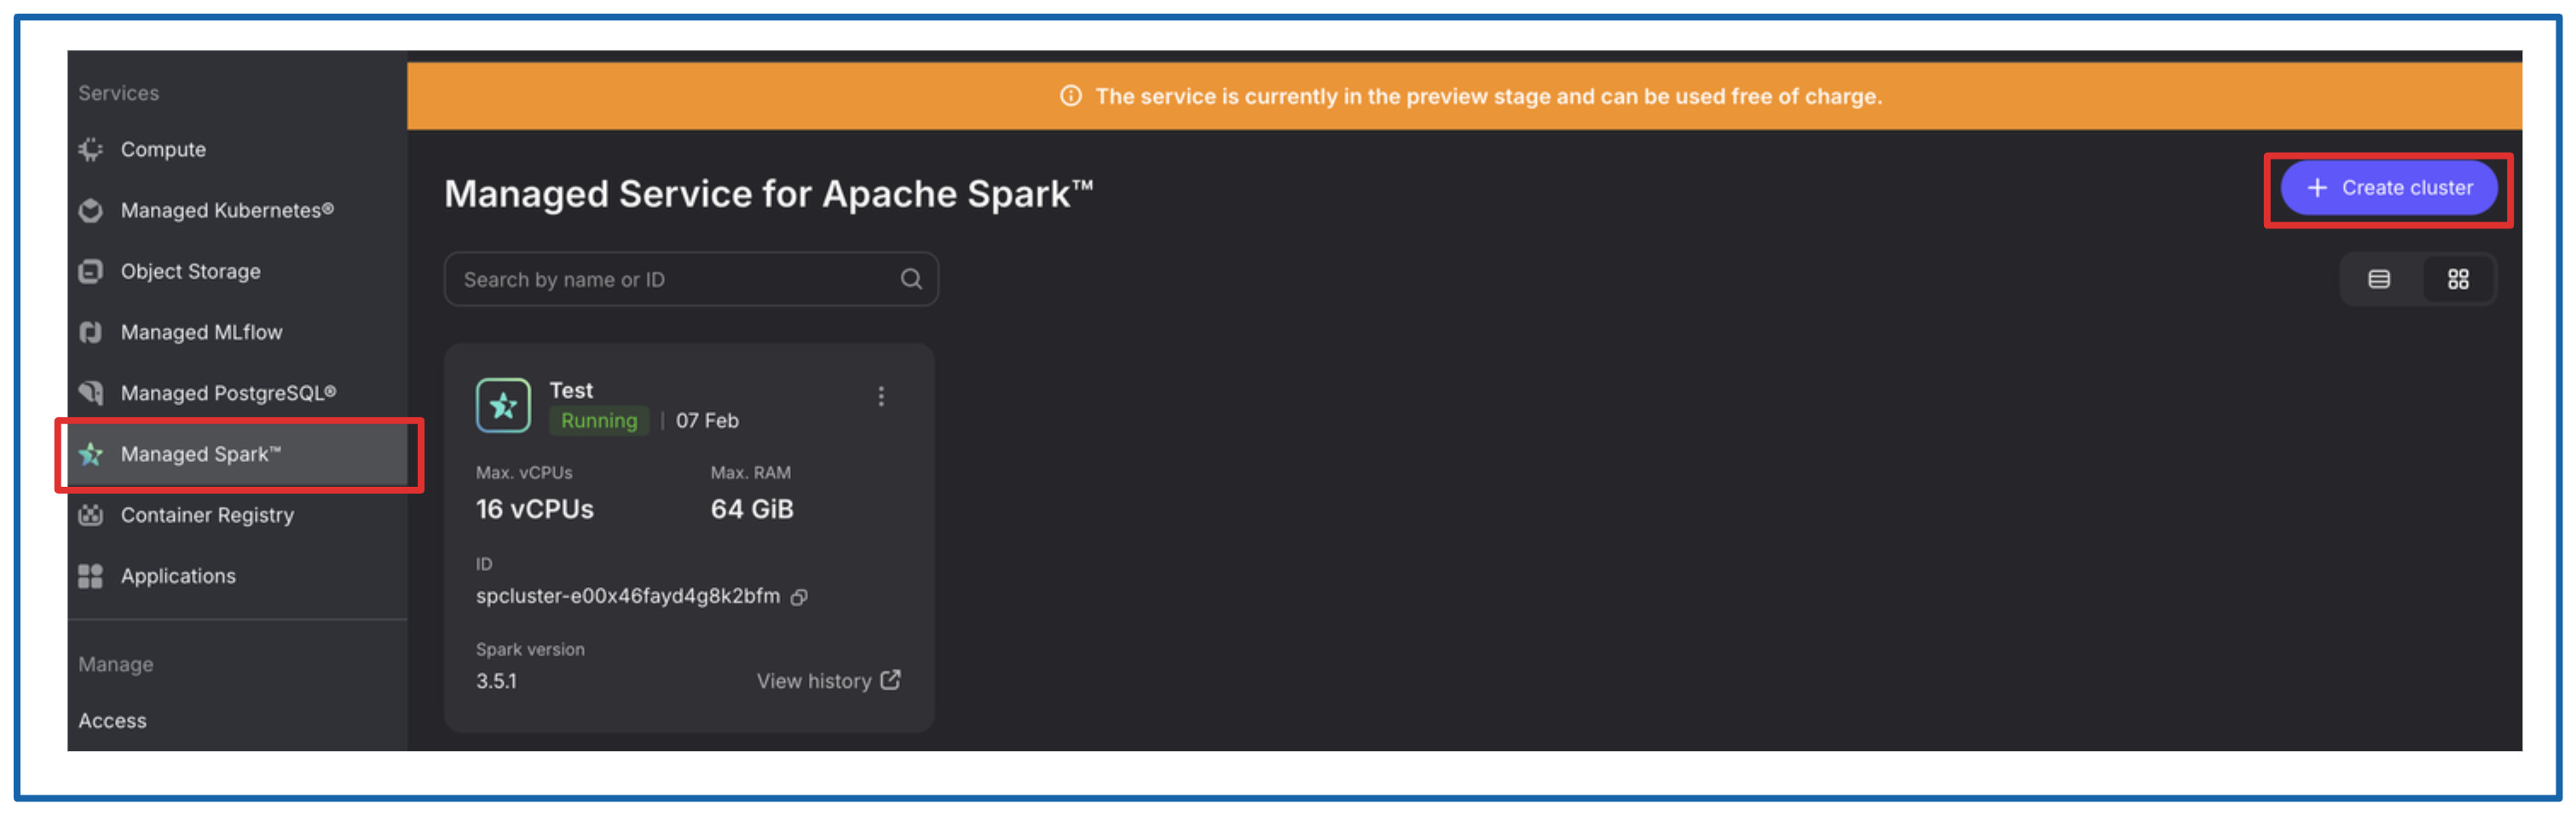
Creating Spark Cluster.
Creation of the cluster is straightforward, go to Managed Spark section and click on “+Create cluster”.
Configure it:
Give it a name.
Select the beefiest configuration, it’s free ;)
Create a password, you will need it in the Airflow section.
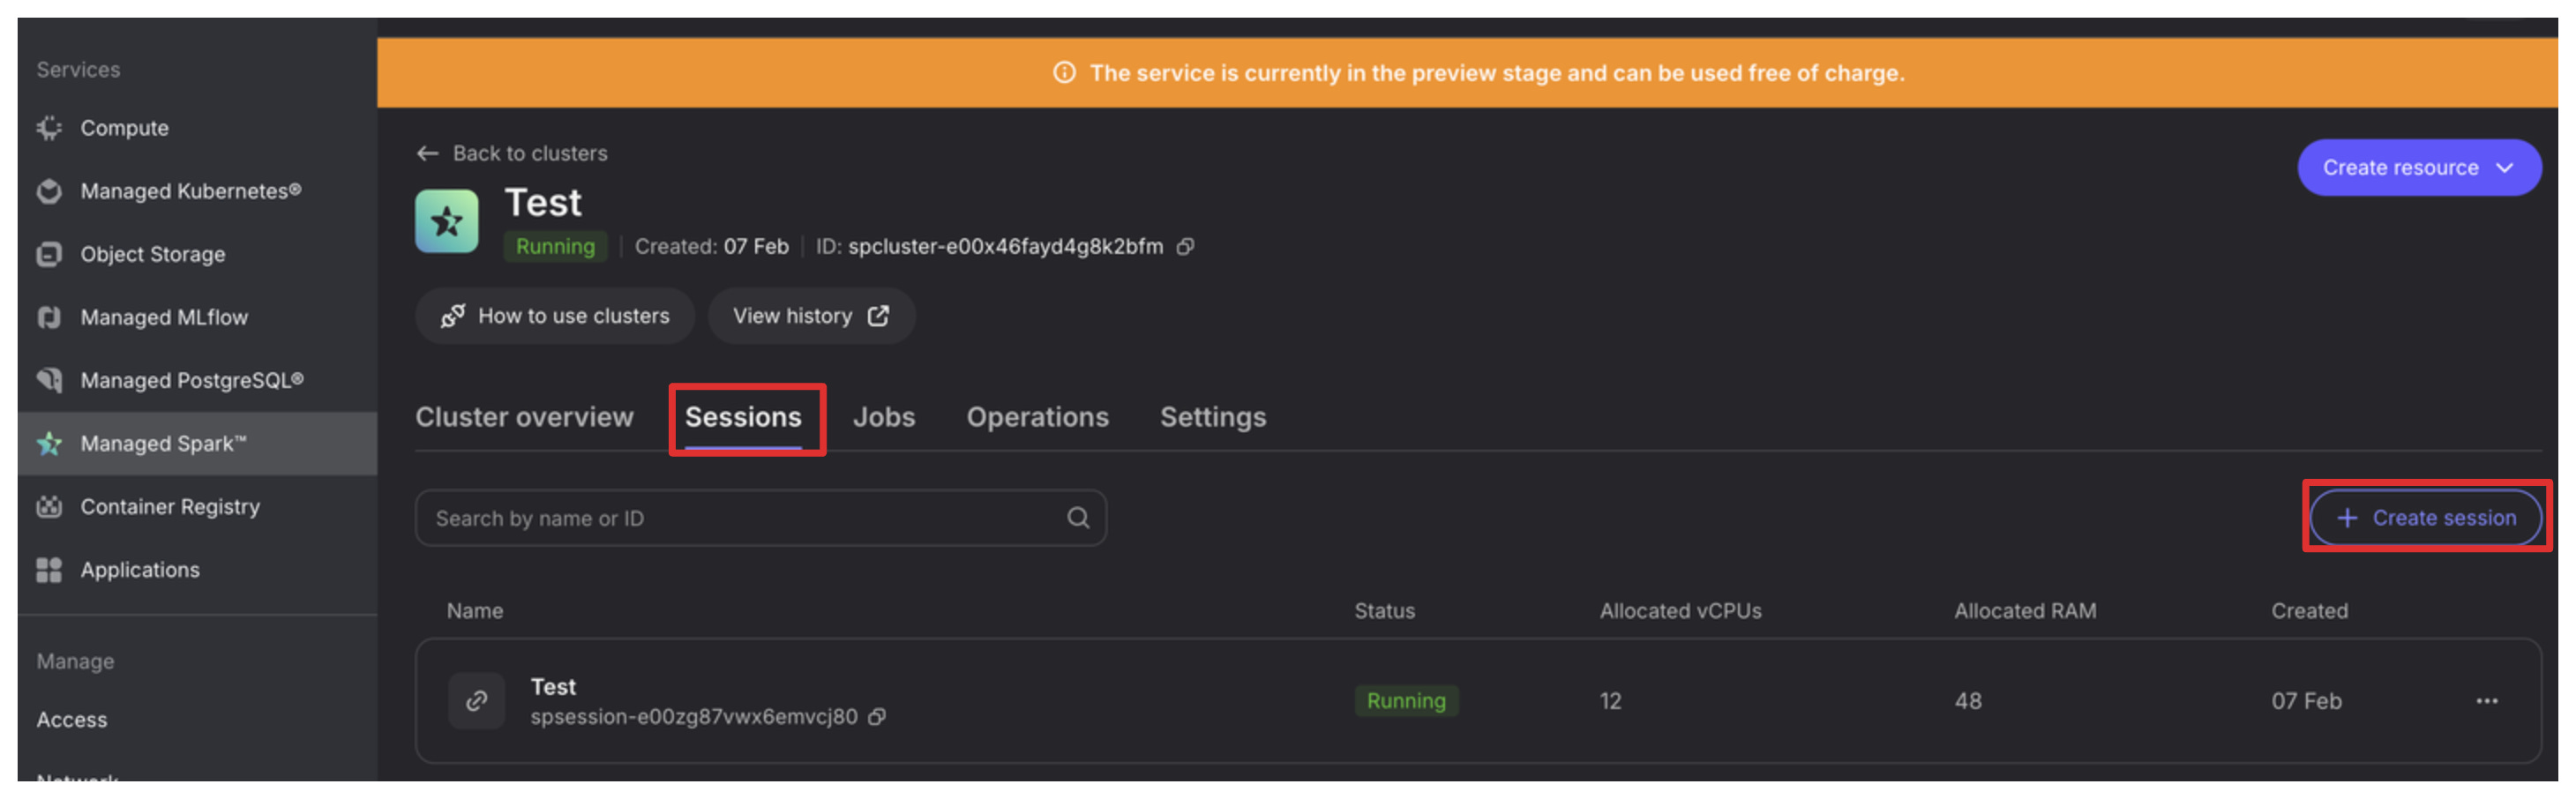
Start a session:
Go to Sessions tab in the created cluster.
Click “+Create session”
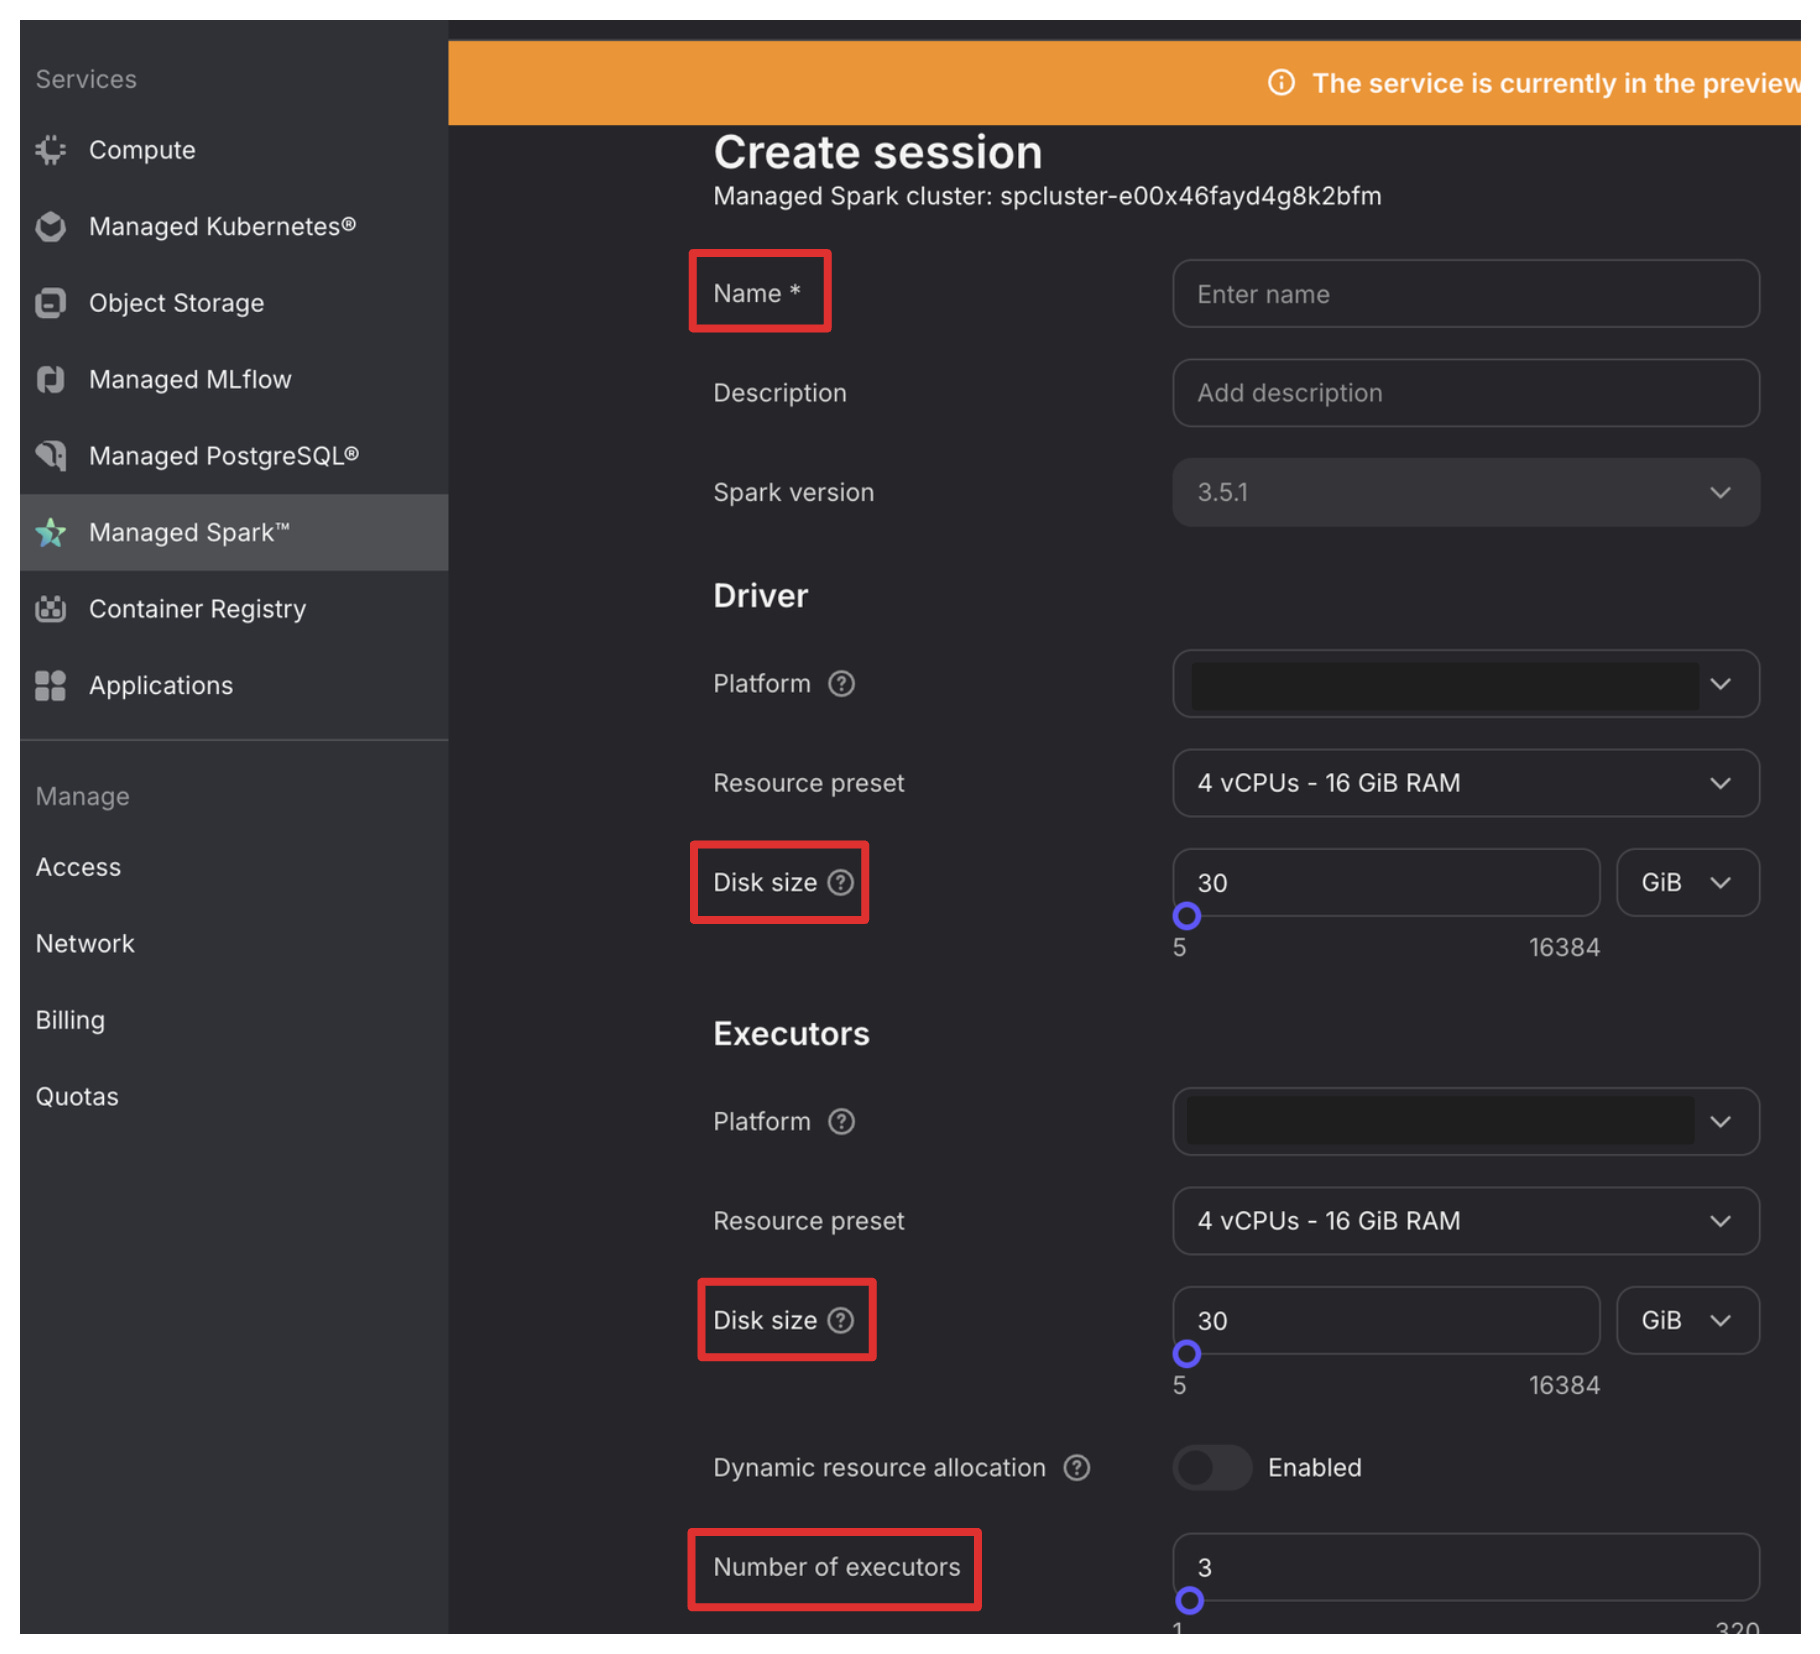
Most default configurations will be good:
Name your session.
Give some breathing room to the driver and executors by increasing Disk size a bit.
bump the number of executors to 3.
That’s it, we have our Spark cluster ready to take our work.
Running Airflow.
We will be deploying Airflow Application on the K8s cluster we have already deployed. Here is how you can easily do it in Nebius:
When in the target cluster window select Applications tab. Look for Airflow and select the card under “All applications”.
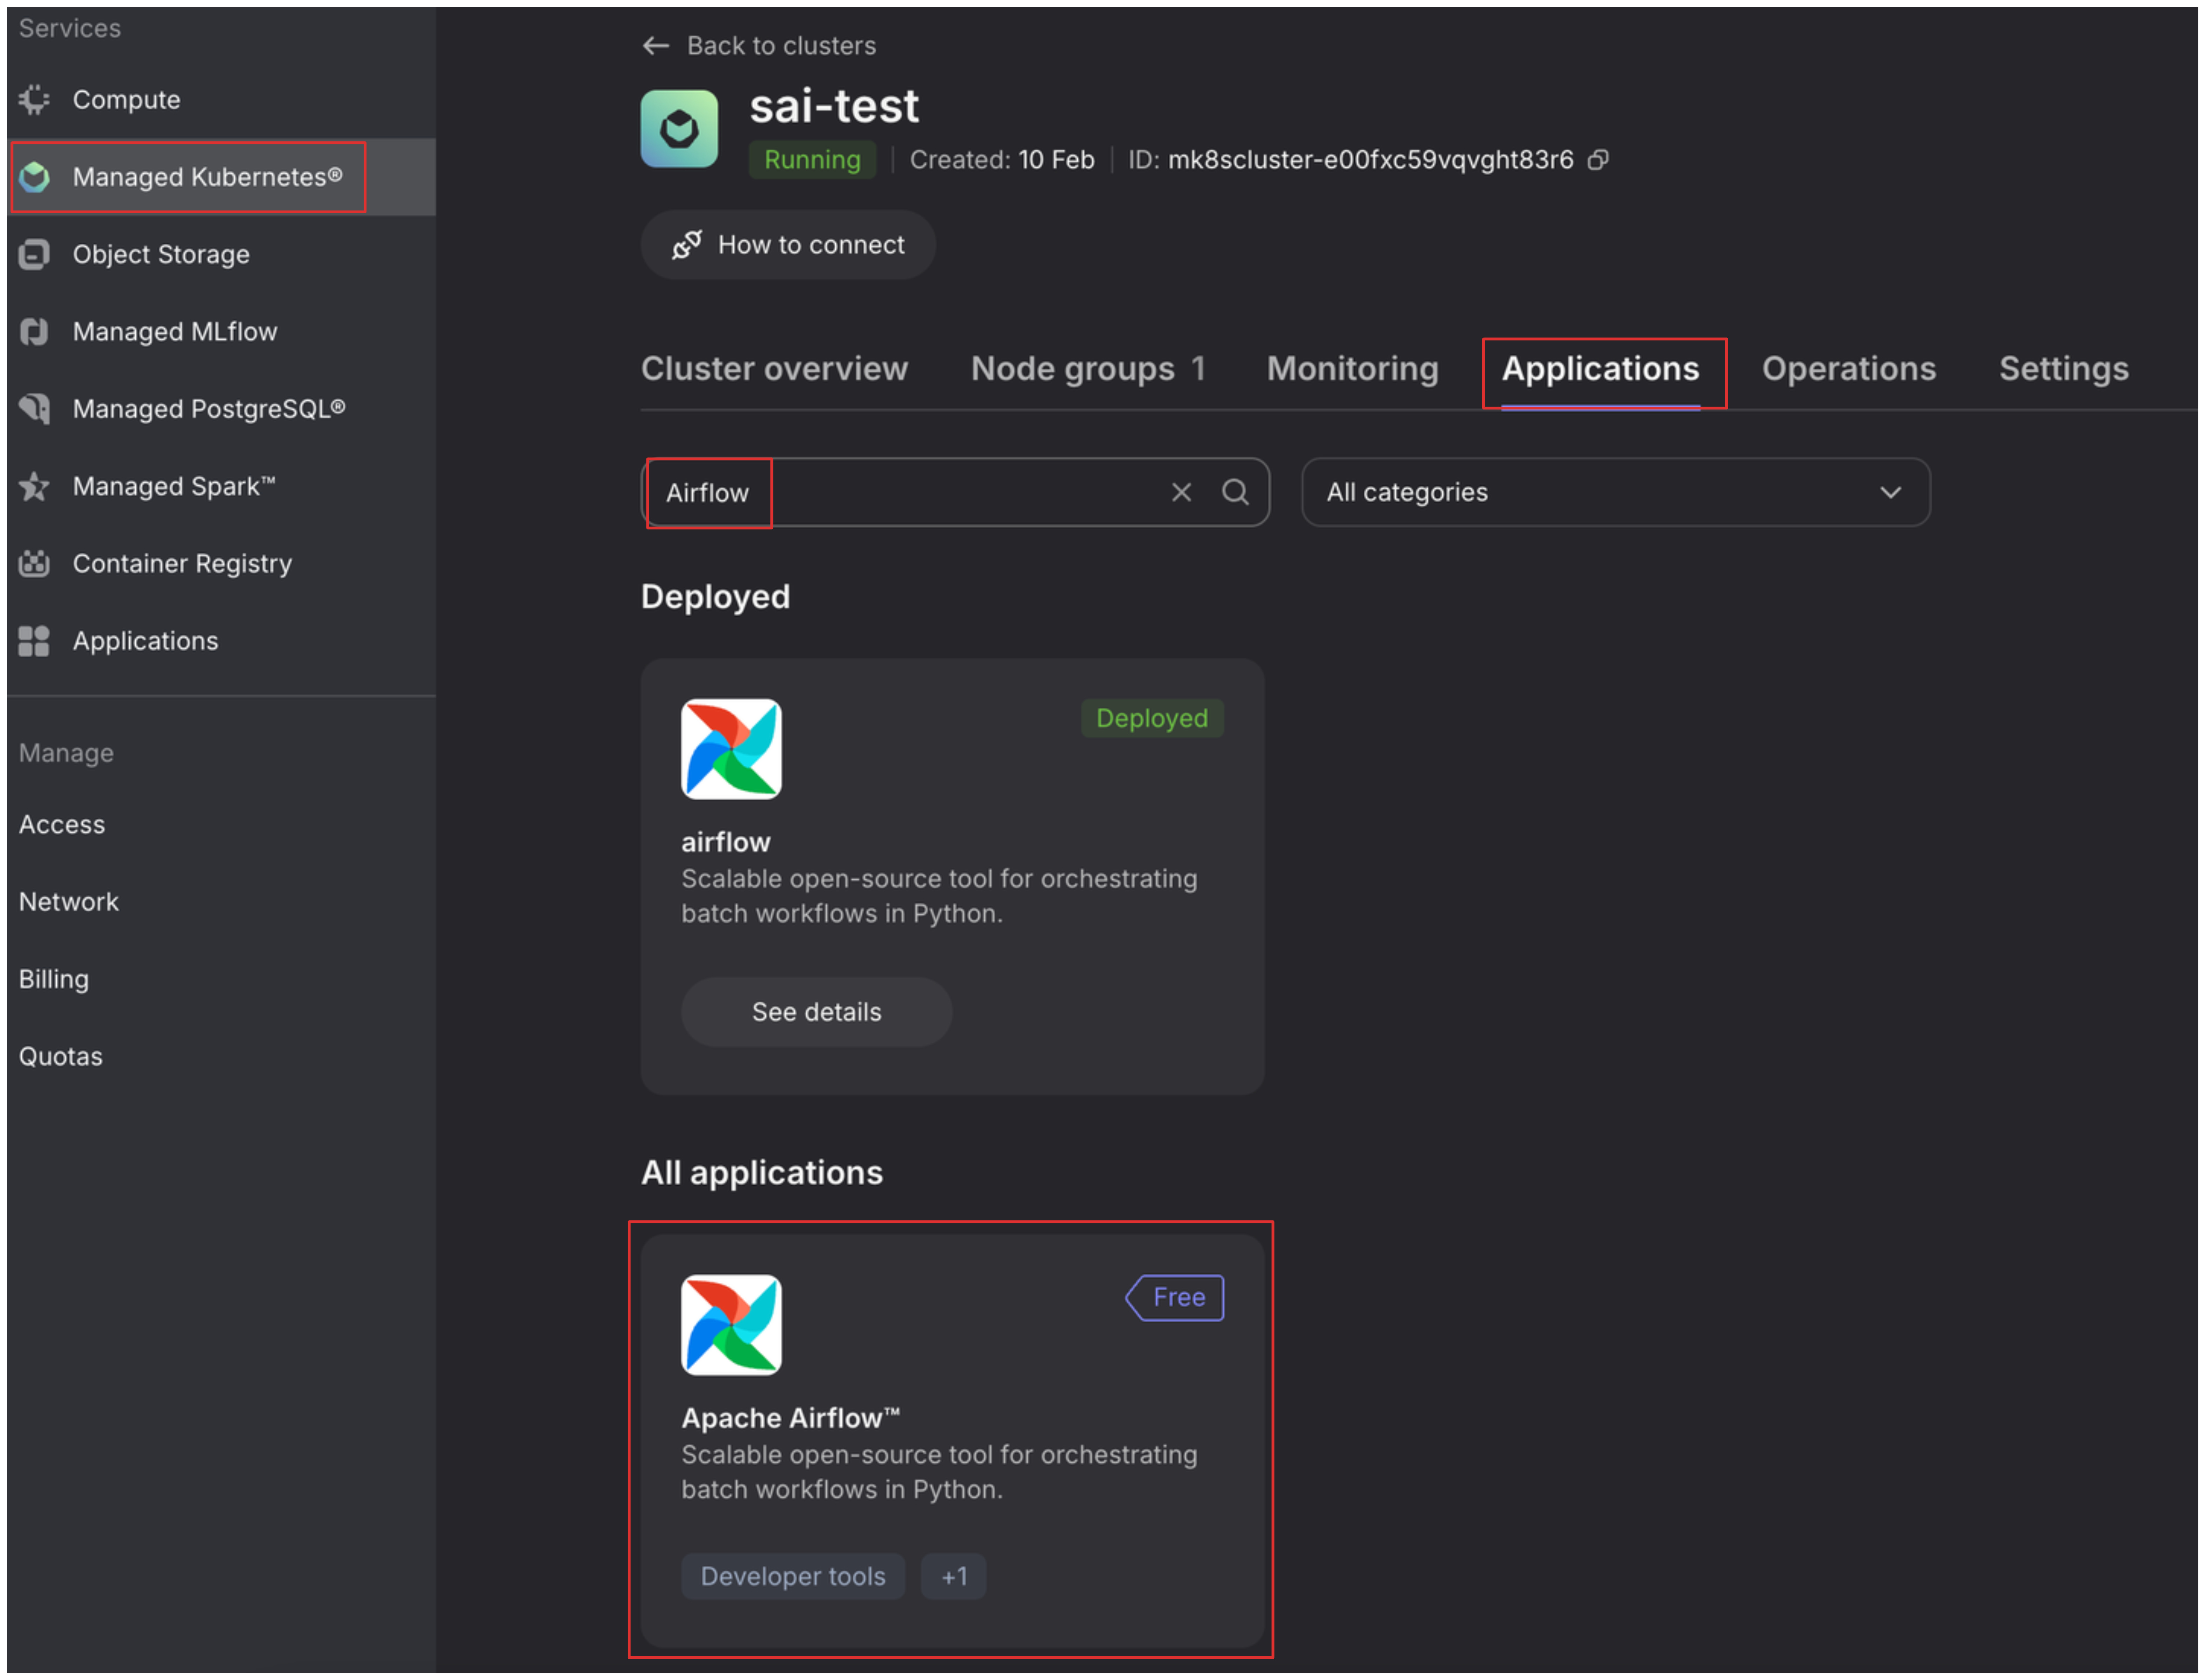
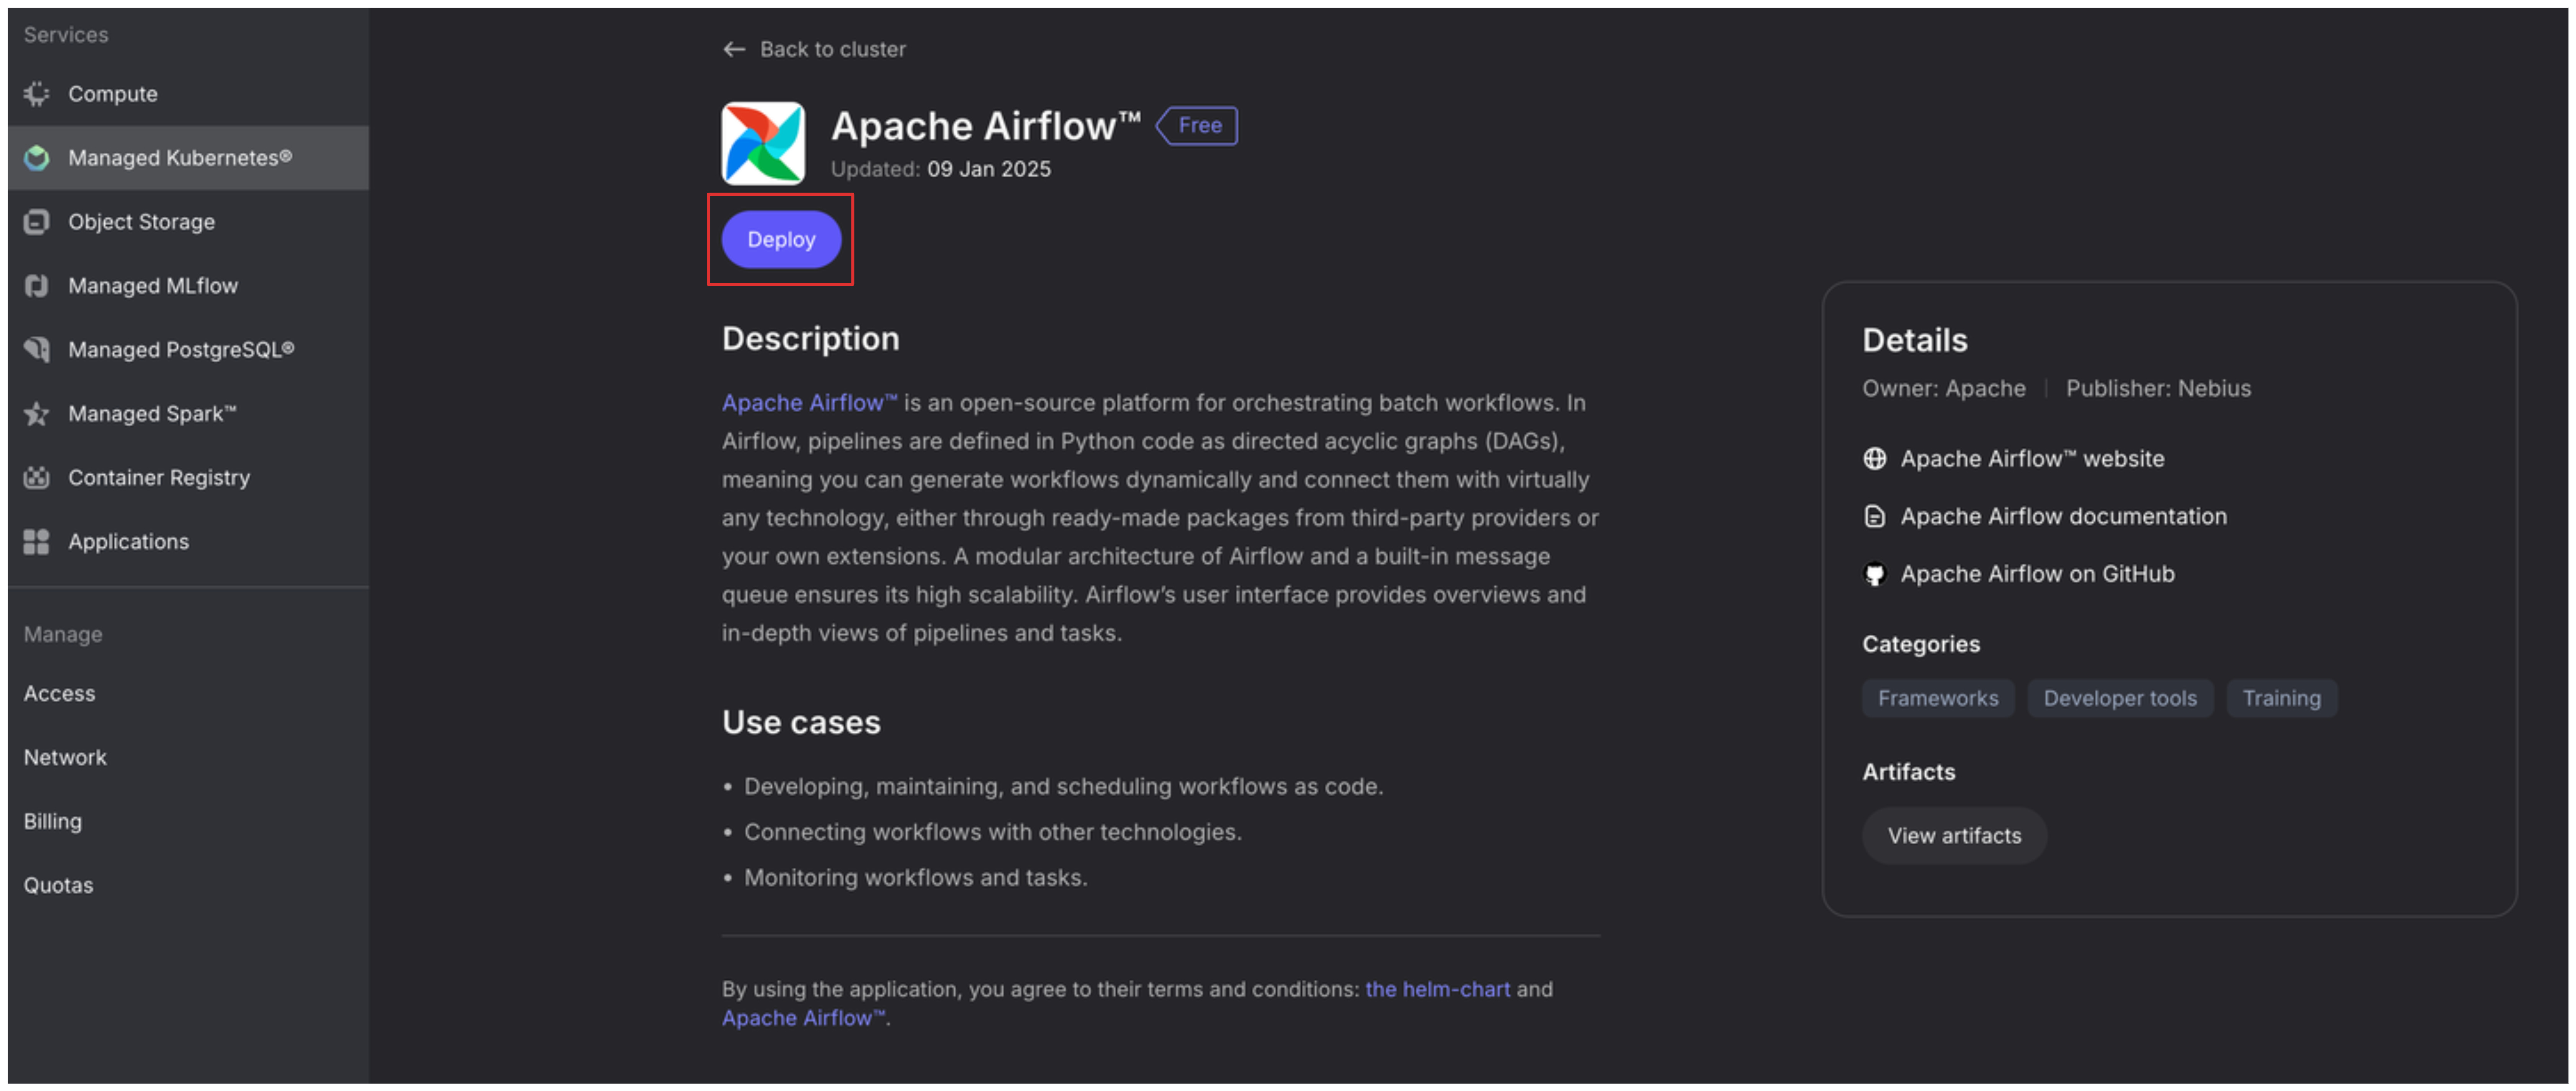
You will be dropped to application details window, continue by selecting deploy.
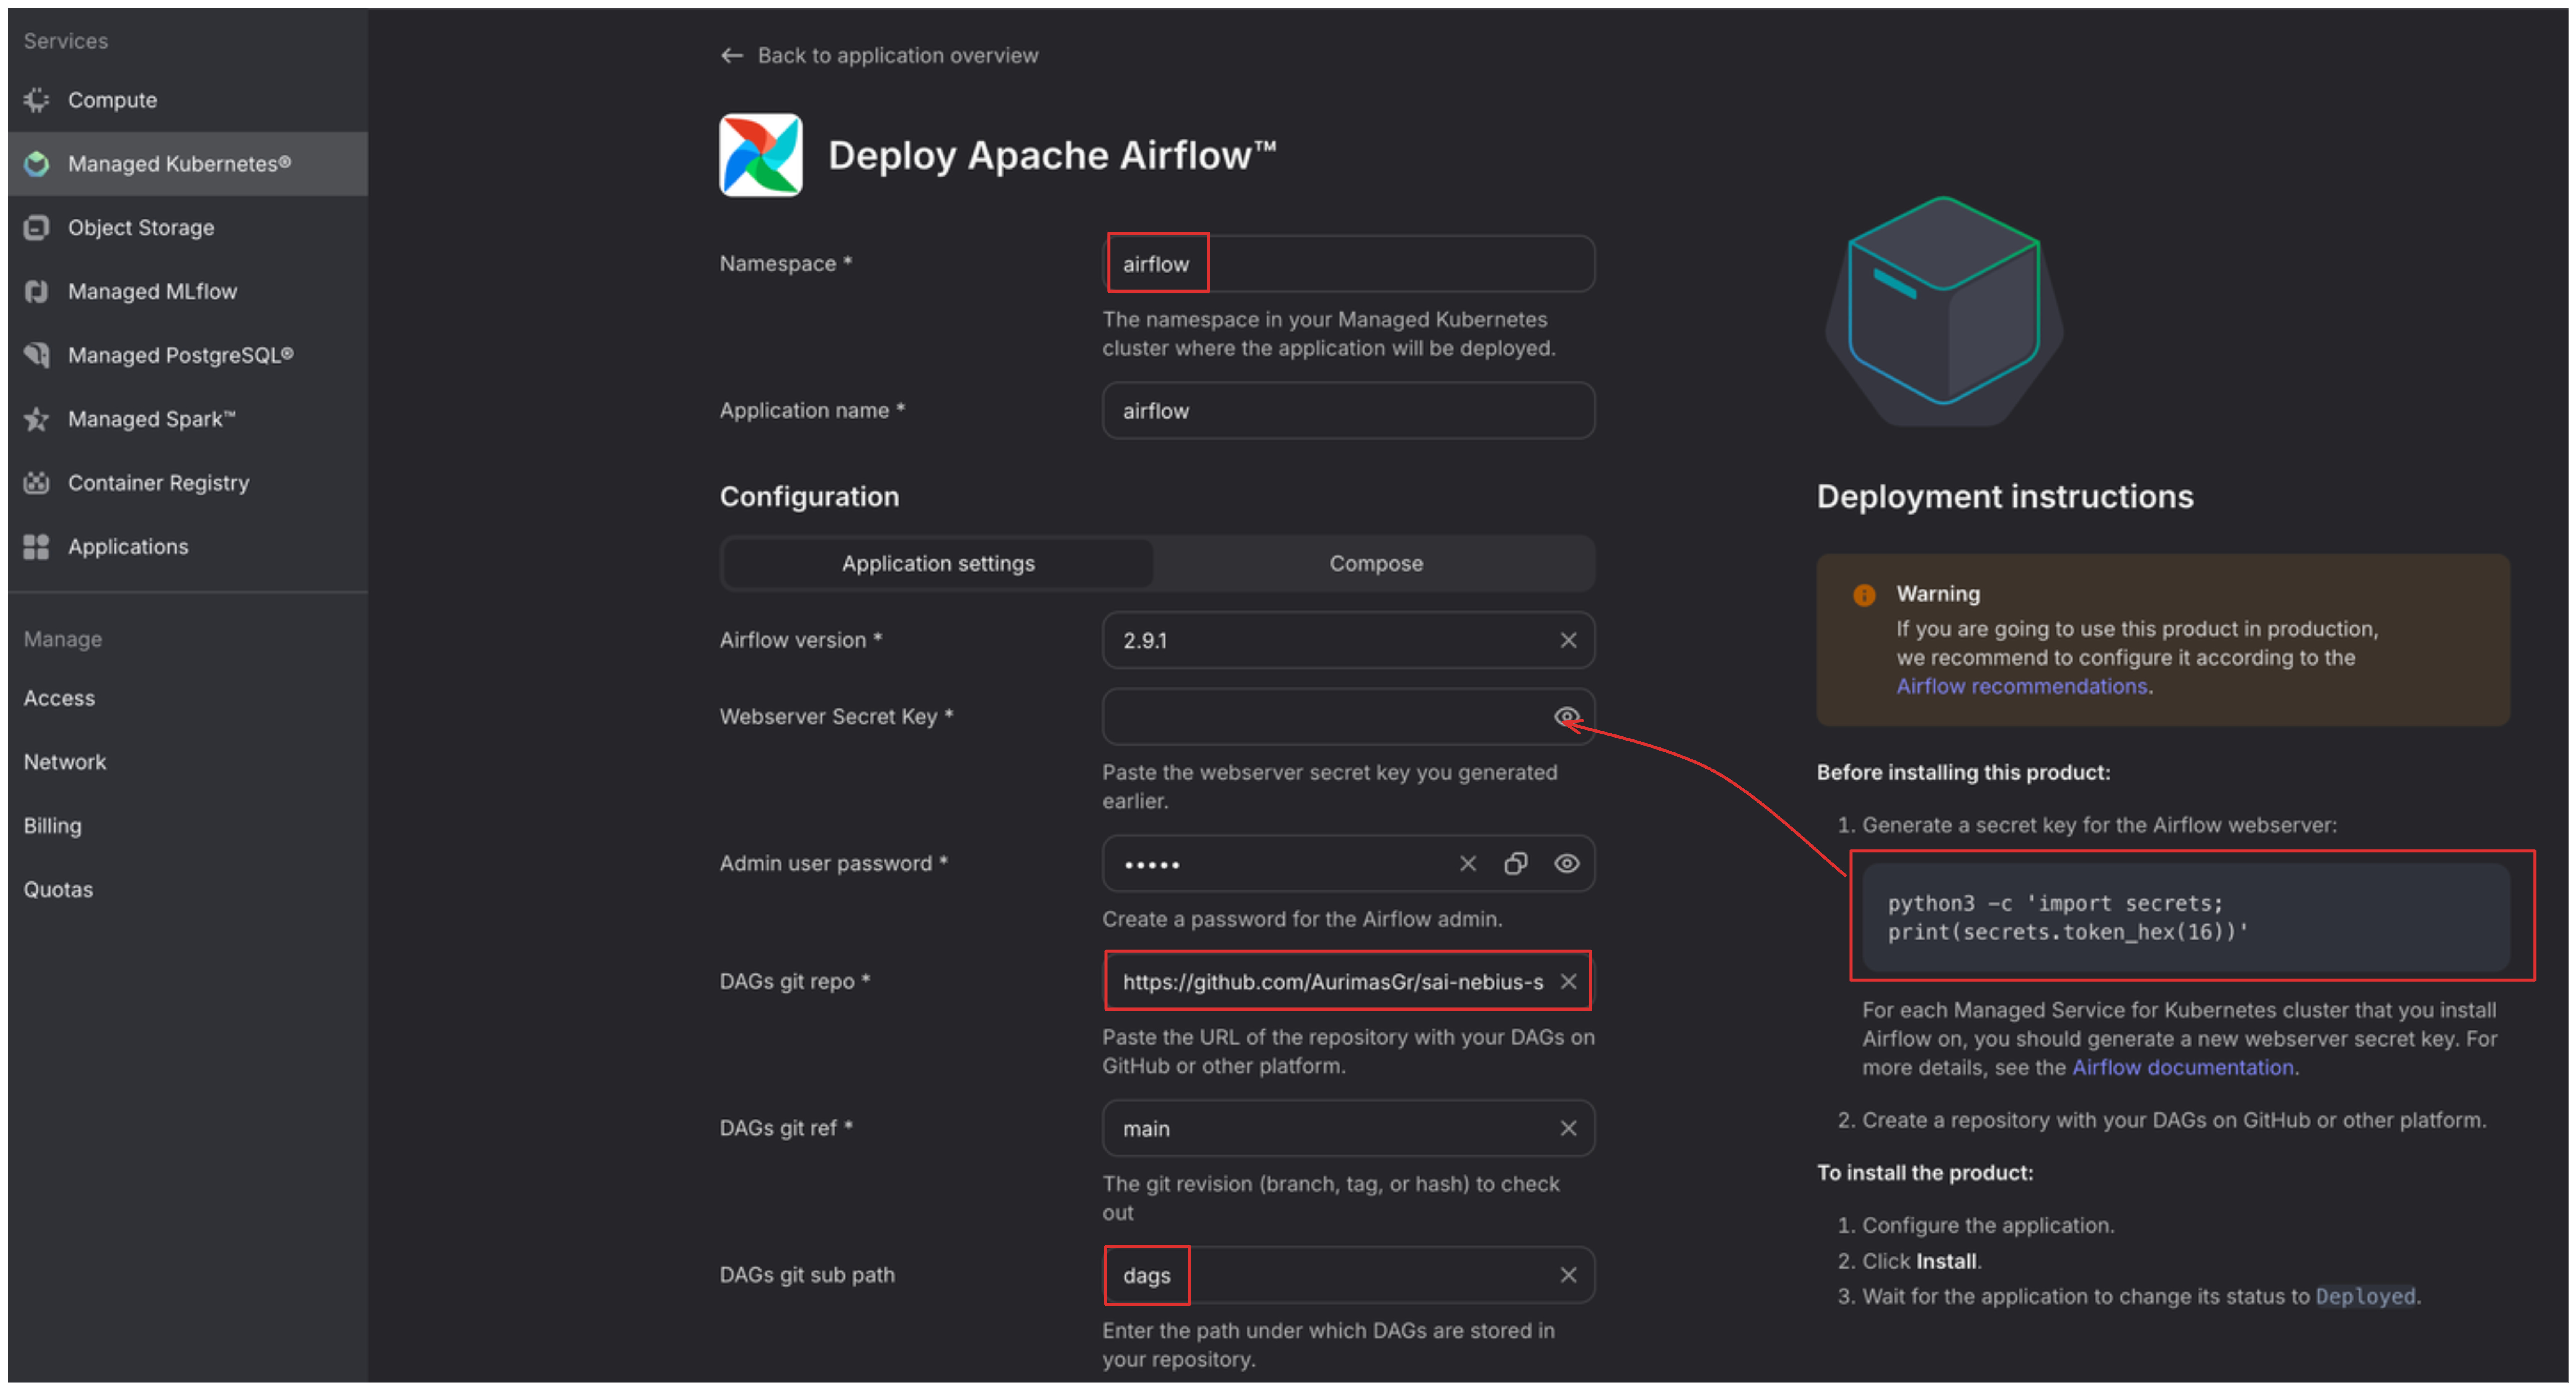
In the following window edit some important fields:
In the Namespace field add airflow - it will help us monitor the health of applications as we are deploying more than one in the cluster.
Webserver Secret Key - follow the instructions on the right to generate the value.
In the DAGs git repo field add the url to your github repo. You can also use mine if you just want to follow the example - https://github.com/AurimasGr/sai-nebius-spark.git
DAGs git sub path - point to the folder where you are storing the DAG files in your repository. Mine are under dags as you can see in the picture below.
[Important]: I have emitted one field from the image - Custom Airflow Image. We will need a custom one, because we will be running spark directly in Airflow via attached Spark Session, hence we need nebius-connect library installed. You can add aurimasg/airflow there, it will pull the image from my docker hub registry if you keep Airflow version at 2.9.1 as per default. If you want to build your own image, you can do that by going to airflow folder in my github repo and running:
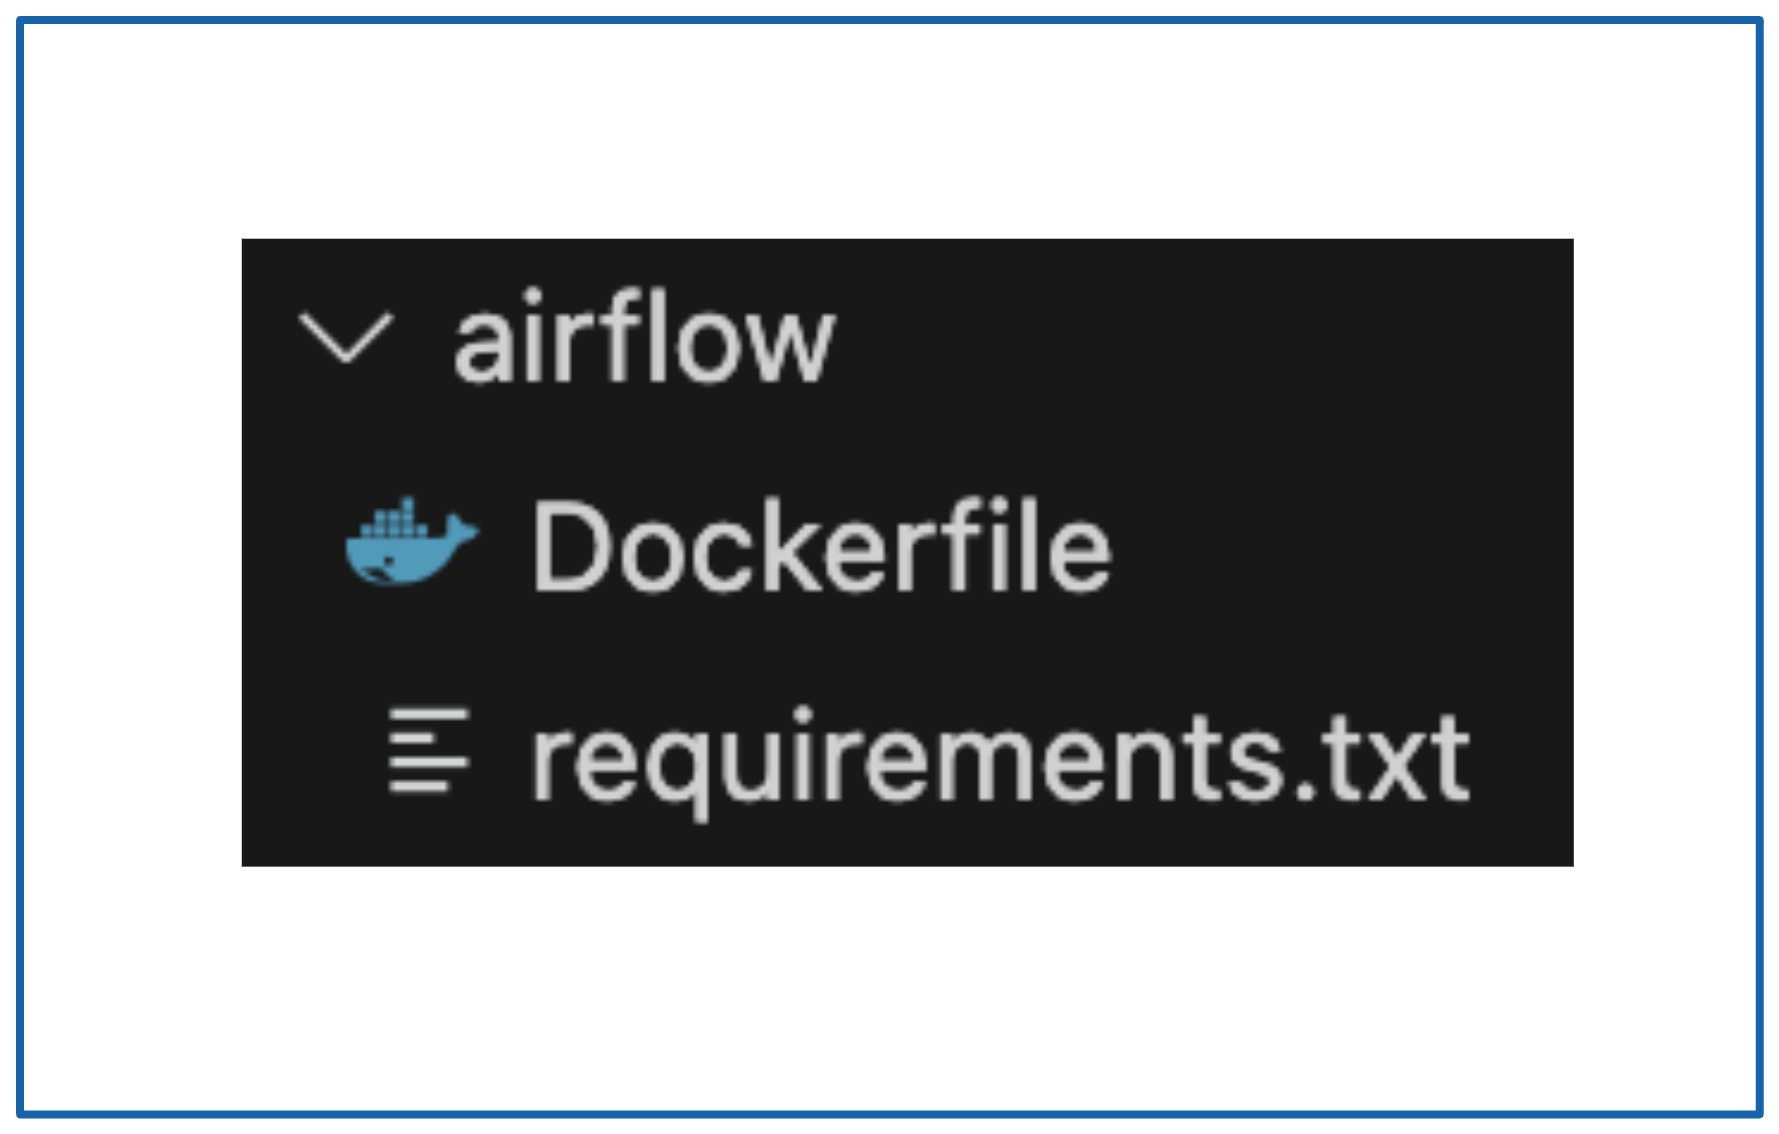
docker build . --platform linux/amd64 -t <docker_hub_account>/<repository>:2.9.1docker push <docker_hub_account>/<repository>:2.9.1Then you can also add <docker_hub_account>/<repository> in the Custom Airflow Image field.
Deploy the application and wait for it to successfully spin up. You can check status by running:
kubectl get pods -n airflowOnce fully deployed, you should see something like this:
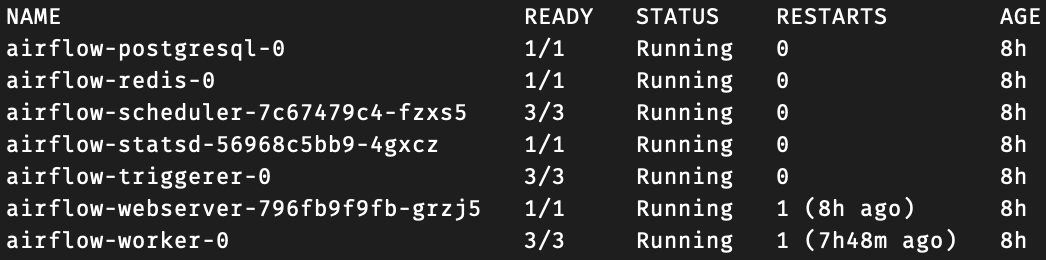
Expose access to airflow by running:
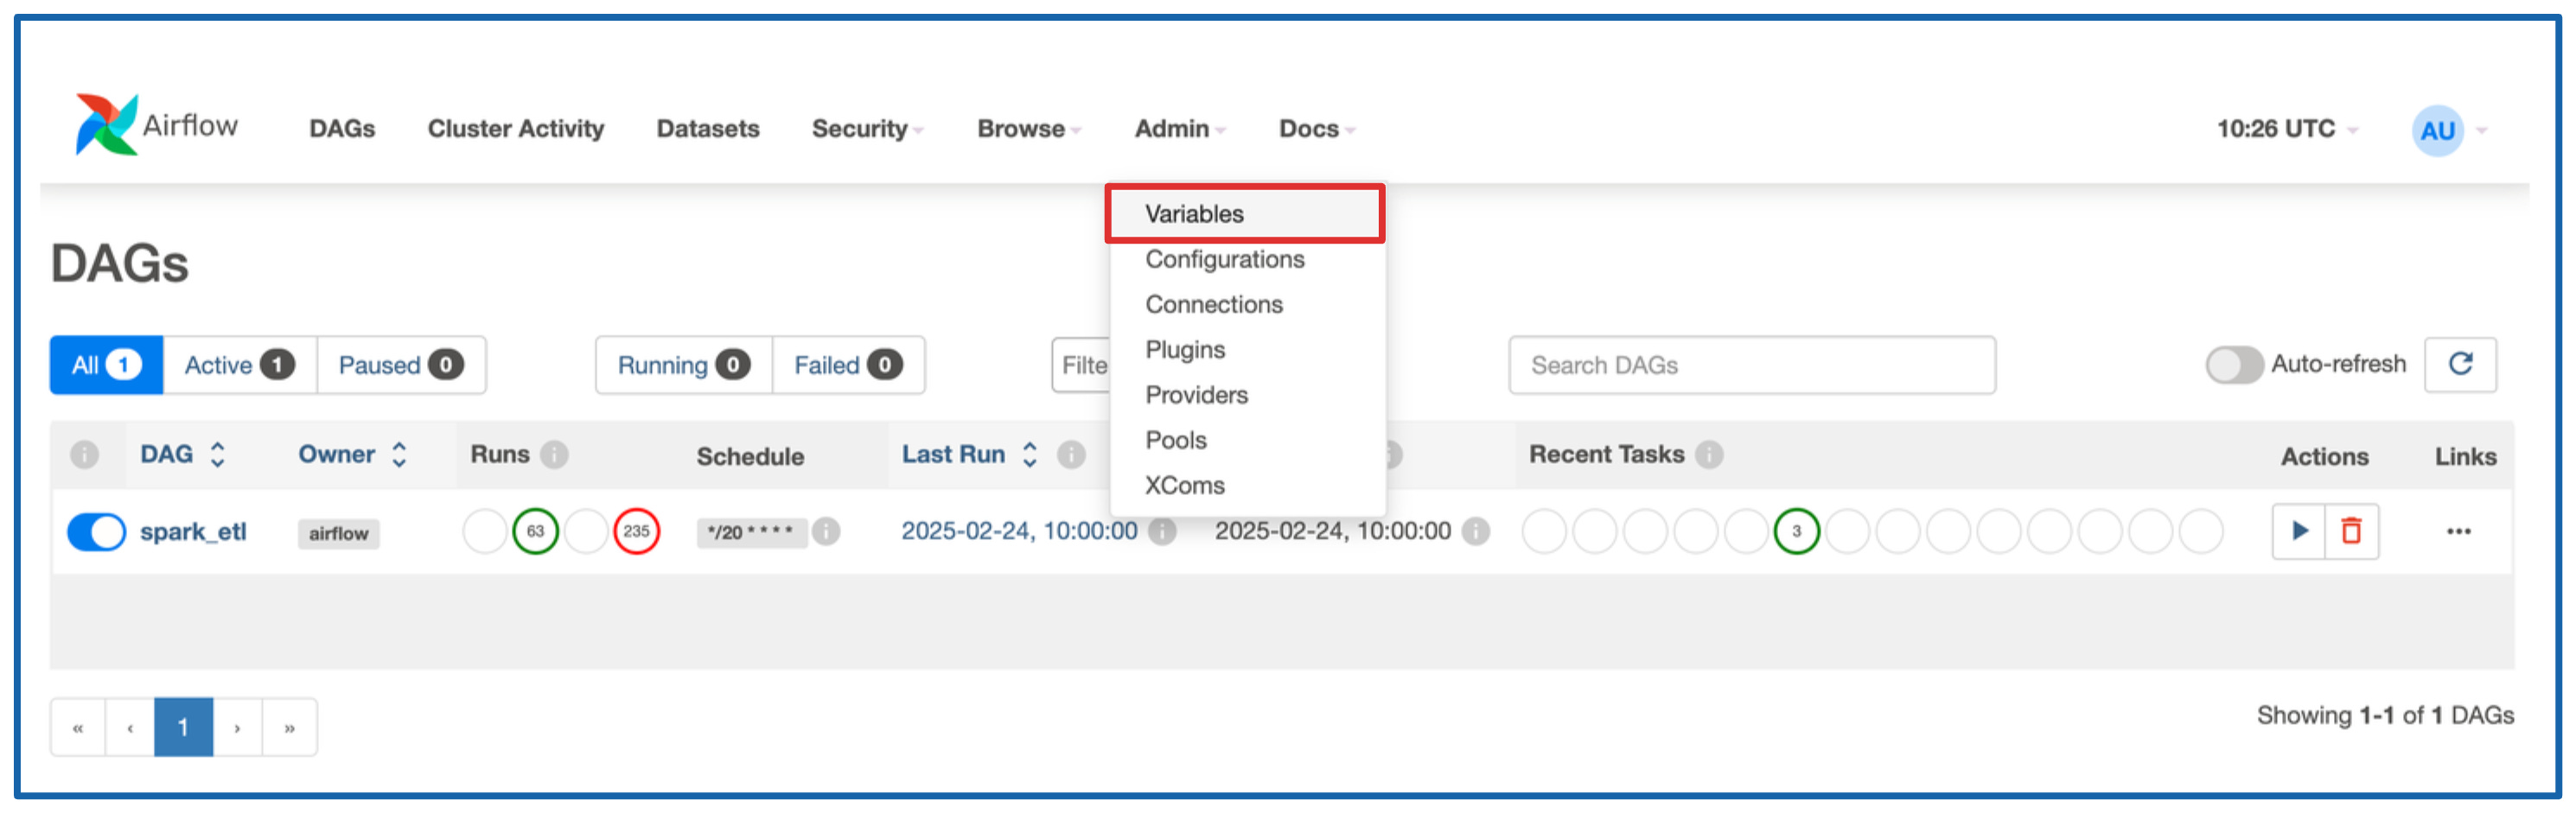
kubectl -n airflow port-forward services/airflow-webserver 8080:8080You can now go to localhost:8080 to access Airflow UI. Log in with admin:admin credentials. Congratulations, now you can run your DAGs. If you have already pointed Airflow to the DAG folder that contains the ETL script, you will see some errors. The are all relating to Airflow Variables that need to be configured to run the app. Here is what you need to do:
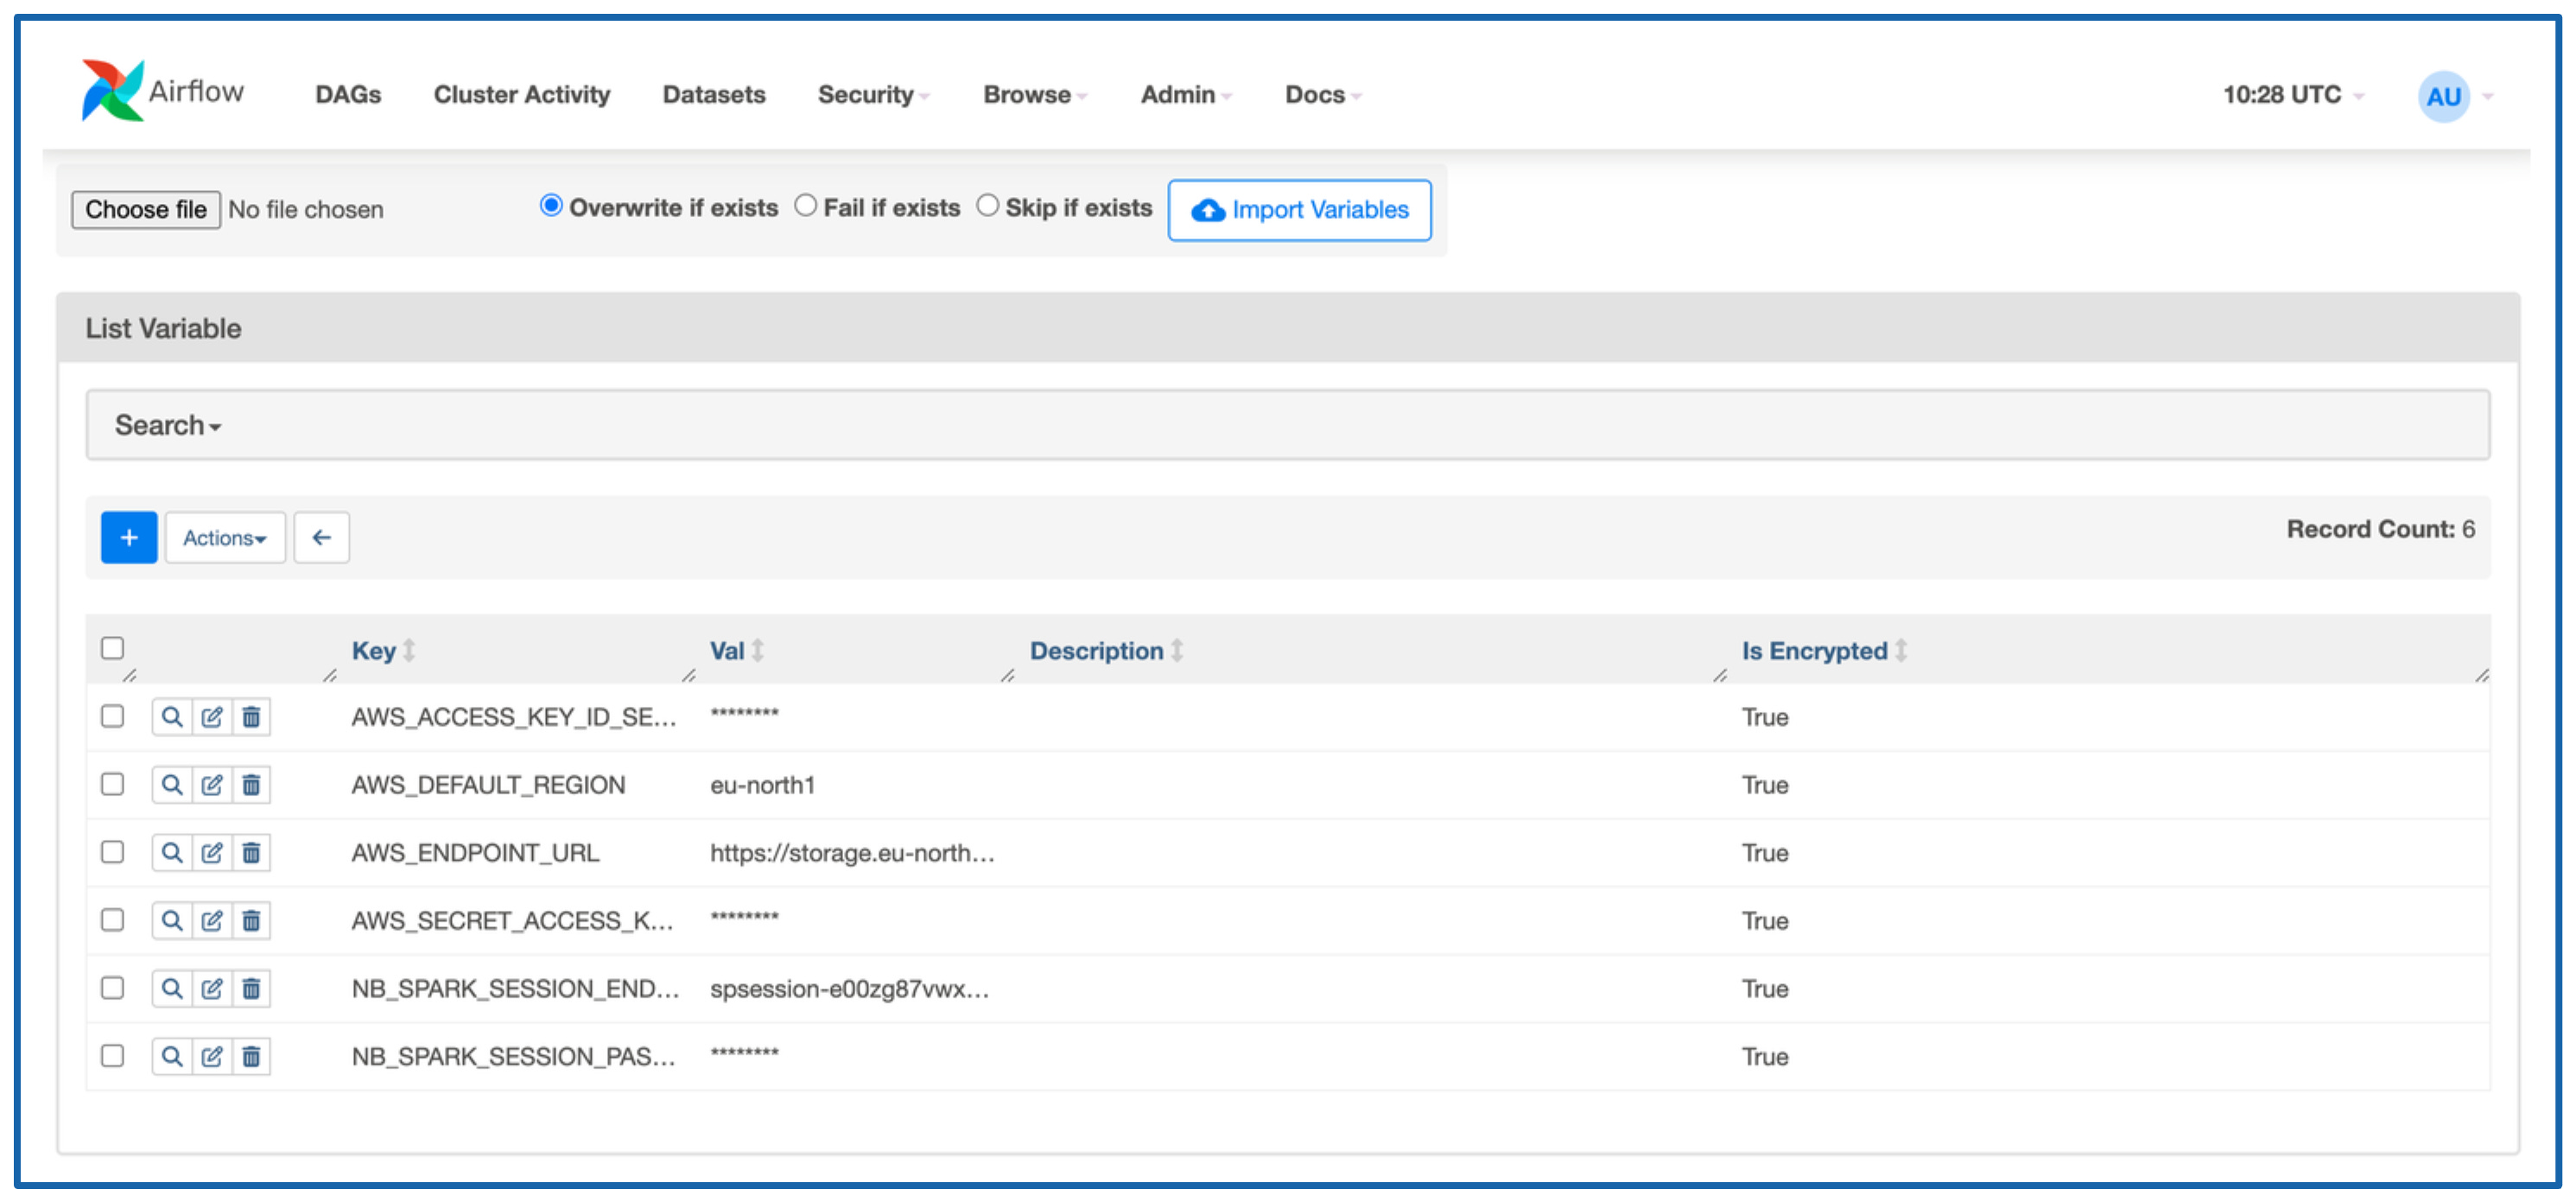
Go to Admin → Variables.
In the picture I have mine already configured, but here is what you will need:
AWS_ACCESS_KEY_ID_SECRET - AWS like AWS_ACCESS_KEY_ID you generated earlier in collector section.
AWS_SECRET_ACCESS_KEY_SECRET - AWS like AWS_SECRET_ACCESS_KEY you generated earlier in collector section.
AWS_DEFAULT_REGION - eu-north1 if you are running in this region.
AWS_ENDPOINT_URL - https://storage.eu-north1.nebius.cloud:443
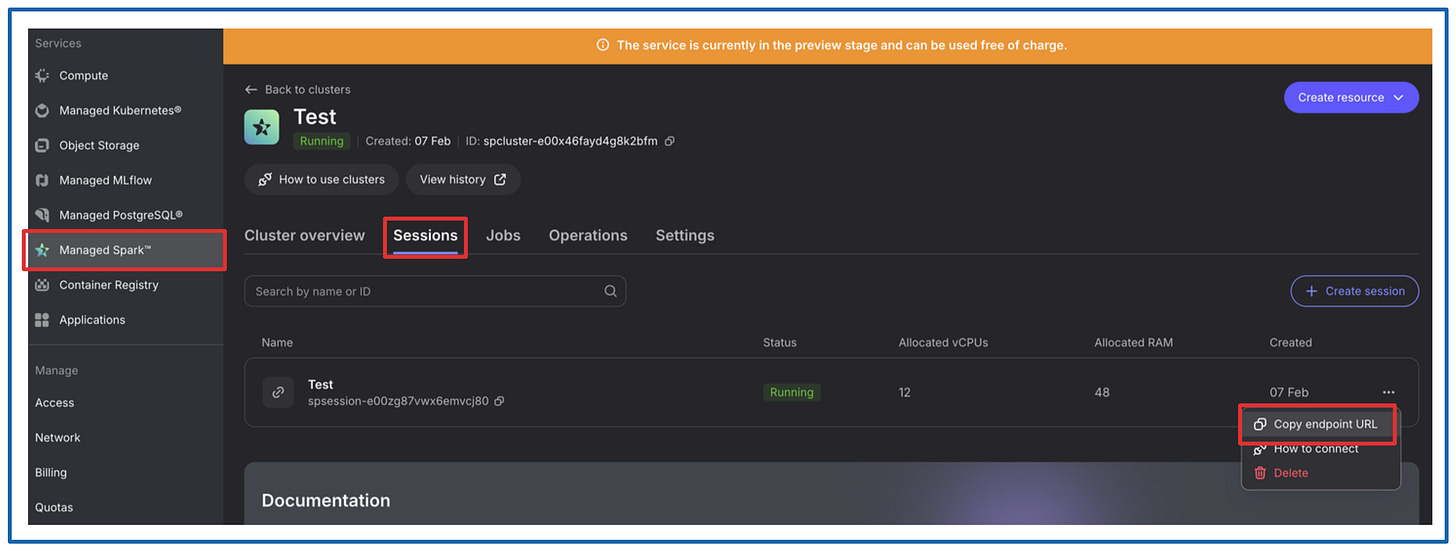
NB_SPARK_SESSION_ENDPOINT - Find it as shown below
NB_SPARK_SESSION_PASSWORD_SECRET - Spark cluster password that you created when bootstrapping the cluster.

Here is the code we will use:
Definition of the DAG:
with DAG(dag_id="spark_etl",
         start_date=datetime(2025, 1, 24),
         max_active_runs=1, catchup=False,
         schedule="*/20 * * * *") as dag:

    @task()
    def move_data_to_processing():
        move_objects(RAW_LANDING_BUCKET, RAW_PROCESSING_BUCKET)

    @task()
    def run_processing():
        process_data(time_now)

    @task()
    def clean_procesing():
        archive_objects(RAW_PROCESSING_BUCKET, ARCHIVE_BUCKET, time_now)

    move_data_to_processing() >> run_processing() >> clean_procesing()
It will run every 20 minutes and run functions move_objects(), process_data(), archive_objects() in sequence.
Here are the functions themselves:
move_objects() - simply moves objects from one bucket to another. We will use it to move all data accumulated in sai-raw bucket to sai-processing bucket:
def move_objects(source_bucket, destination_bucket):
    # List all objects in the source bucket
    response = s3.list_objects_v2(Bucket=source_bucket)

    if 'Contents' not in response:
        print("No objects found in the source bucket.")
        return

    for obj in response['Contents']:
        key = obj['Key']
        print(f"Moving: {key}")

        # Copy the object to the destination bucket
        copy_source = {'Bucket': source_bucket, 'Key': key}
        s3.copy_object(CopySource=copy_source, Bucket=destination_bucket, Key=key)

        # Delete the object from the source bucket after copying
        s3.delete_object(Bucket=source_bucket, Key=key)

        print(f"Moved {key} to {destination_bucket}")

    print("All objects have been moved.")

    return "Success"
process_data() - this is the spark function that reads all the json objects in sai-procesing bucket, groups events by event_type, major schema, adds etl_timestamp and transforms the data to structured format. Then it writes the result to sai-processed bucket:
def process_data(etl_timestamp):

    from pyspark.sql.connect.session import SparkSession
    from nebius.spark.connect import create_channel_builder
    from os.path import expanduser
    from pyspark.sql.functions import from_json, col, lit

    import urllib.request

    print(os.environ["NB_SPARK_SESSION_ENDPOINT"])

    url = "https://storage.eu-north1.nebius.cloud/msp-certs/ca.pem"

    urllib.request.urlretrieve(url, "ca.pem")

    nebius_spark_endpoint = os.environ["NB_SPARK_SESSION_ENDPOINT"] + ':443'
    nebius_spark_cb = create_channel_builder(
        nebius_spark_endpoint,
        password=os.environ["NB_SPARK_CLUSTER_PASSWORD"],
        root_certificates_file=expanduser('ca.pem')
    )

    print(expanduser('ca.pem'))

    spark = (SparkSession
        .builder
        .channelBuilder(nebius_spark_cb)
        .getOrCreate())

    df_raw = spark.read.schema(schema).json(f"s3a://{RAW_PROCESSING_BUCKET}/")
    distinct_groups = df_raw.select("event_type", "schema_version").distinct().collect()

    for (event_type, schema_version) in [(str(row["event_type"]), str(row["schema_version"])) for row in distinct_groups]:
        (df_raw
        .filter(df_raw.event_type == event_type)
        .filter(df_raw.schema_version == schema_version)
        .withColumn('payload', from_json(col('payload'), schema_map.get(f"{event_type}_{schema_version}")))
        .withColumn('etl_timestamp', lit(etl_timestamp))
        .select("etl_timestamp", "collector_id", "collector_tstamp", "event_type", "root_id", "schema_version", "payload.*")
        .write
        .mode("append")
        .partitionBy("etl_timestamp")
        .parquet(f"s3a://{PROCESSED_BUCKET}/{event_type}/{schema_version.split('-')[0]}"))

    return "Success"
archive_objects() - this is similar to the first function but it moves the data from sai-processing to sai-archive bucket and also adds etl_timestamp hierarchy. Why? We might need to reprocess the batch of raw data, we can always do it from the archive bucket.
def archive_objects(source_bucket, destination_bucket, etl_timestamp):
    # List all objects in the source bucket
    response = s3.list_objects_v2(Bucket=source_bucket)

    if 'Contents' not in response:
        print("No objects found in the source bucket.")
        return

    for obj in response['Contents']:
        key = obj['Key']
        print(f"Moving: {key}")

        # Copy the object to the destination bucket
        copy_source = {'Bucket': source_bucket, 'Key': f"{key}"}
        s3.copy_object(CopySource=copy_source, Bucket=destination_bucket, Key=f"{etl_timestamp}/{key}")

        # Delete the object from the source bucket after copying
        s3.delete_object(Bucket=source_bucket, Key=key)

        print(f"Moved {key} to {destination_bucket}")

    print("All objects have been moved.")

    return "Success"
Congratulations on reaching the end!
If you have reached this part of the Newsletter - congratulations! You will be able to see your Spark ETL running every 20 minutes, moving data between the buckets and sai-raw bucket being continuously filled with new raw data.
If you want to play around more, find new datasources and send them through the collector service. Then explore how the data changes in the sai-processed bucket.
Let me know if you had any issues while following the project! Hope to see you in the next article :)