
SAI #27: Event Latency in Data Systems
A look into how event latency builds up as data travels through the Data System

👋 I am Aurimas. I write the SwirlAI Newsletter with the goal of presenting complicated Data related concepts in a simple and easy-to-digest way. My mission is to help You UpSkill and keep You updated on the latest news in Data Engineering, MLOps, Machine Learning and overall Data space.
One of the most important aspects of the Data Pipeline that you will work with as a Data Engineer is ensuring that SLAs agreed upon with your stakeholders are being met. One of the most important parts of the SLA together with data quality is Data Latency. This means ensuring contracts like:
Every day at 4 AM the Data Marts in the Data Warehouse have to contain all of the data that has been generated yesterday until midnight (for a selected time zone).
A real time view of a streaming pipeline should not have data that is delayed by more than 5 minutes from when it was generated.
Data Latency can creep in unexpectedly. What do you do when the SLAs are clearly no longer met and you are processing data from yesterday in the ETL that runs at 6 AM?
The only way to handle these situations is to decompose the Data System and see which separate elements build the latency up. By doing it, you will be able to tune each of the elements separately to achieve a desired latency to meet SLAs. Without doing it you will be running blind.
In todays newsletter I will present an example of what the journey of an event generated in a website might look like and how the latency accumulates while traversing a Batch Data Pipeline. Time when event reaches a specific part of the Data Pipeline will be denoted in the diagrams by T.
General Architecture
I covered General architecture of Website Activity Tracking data ingestion pipeline in one of my previous Newsletter episodes (you can find it here). This time I will group it into 5 fundamental parts.
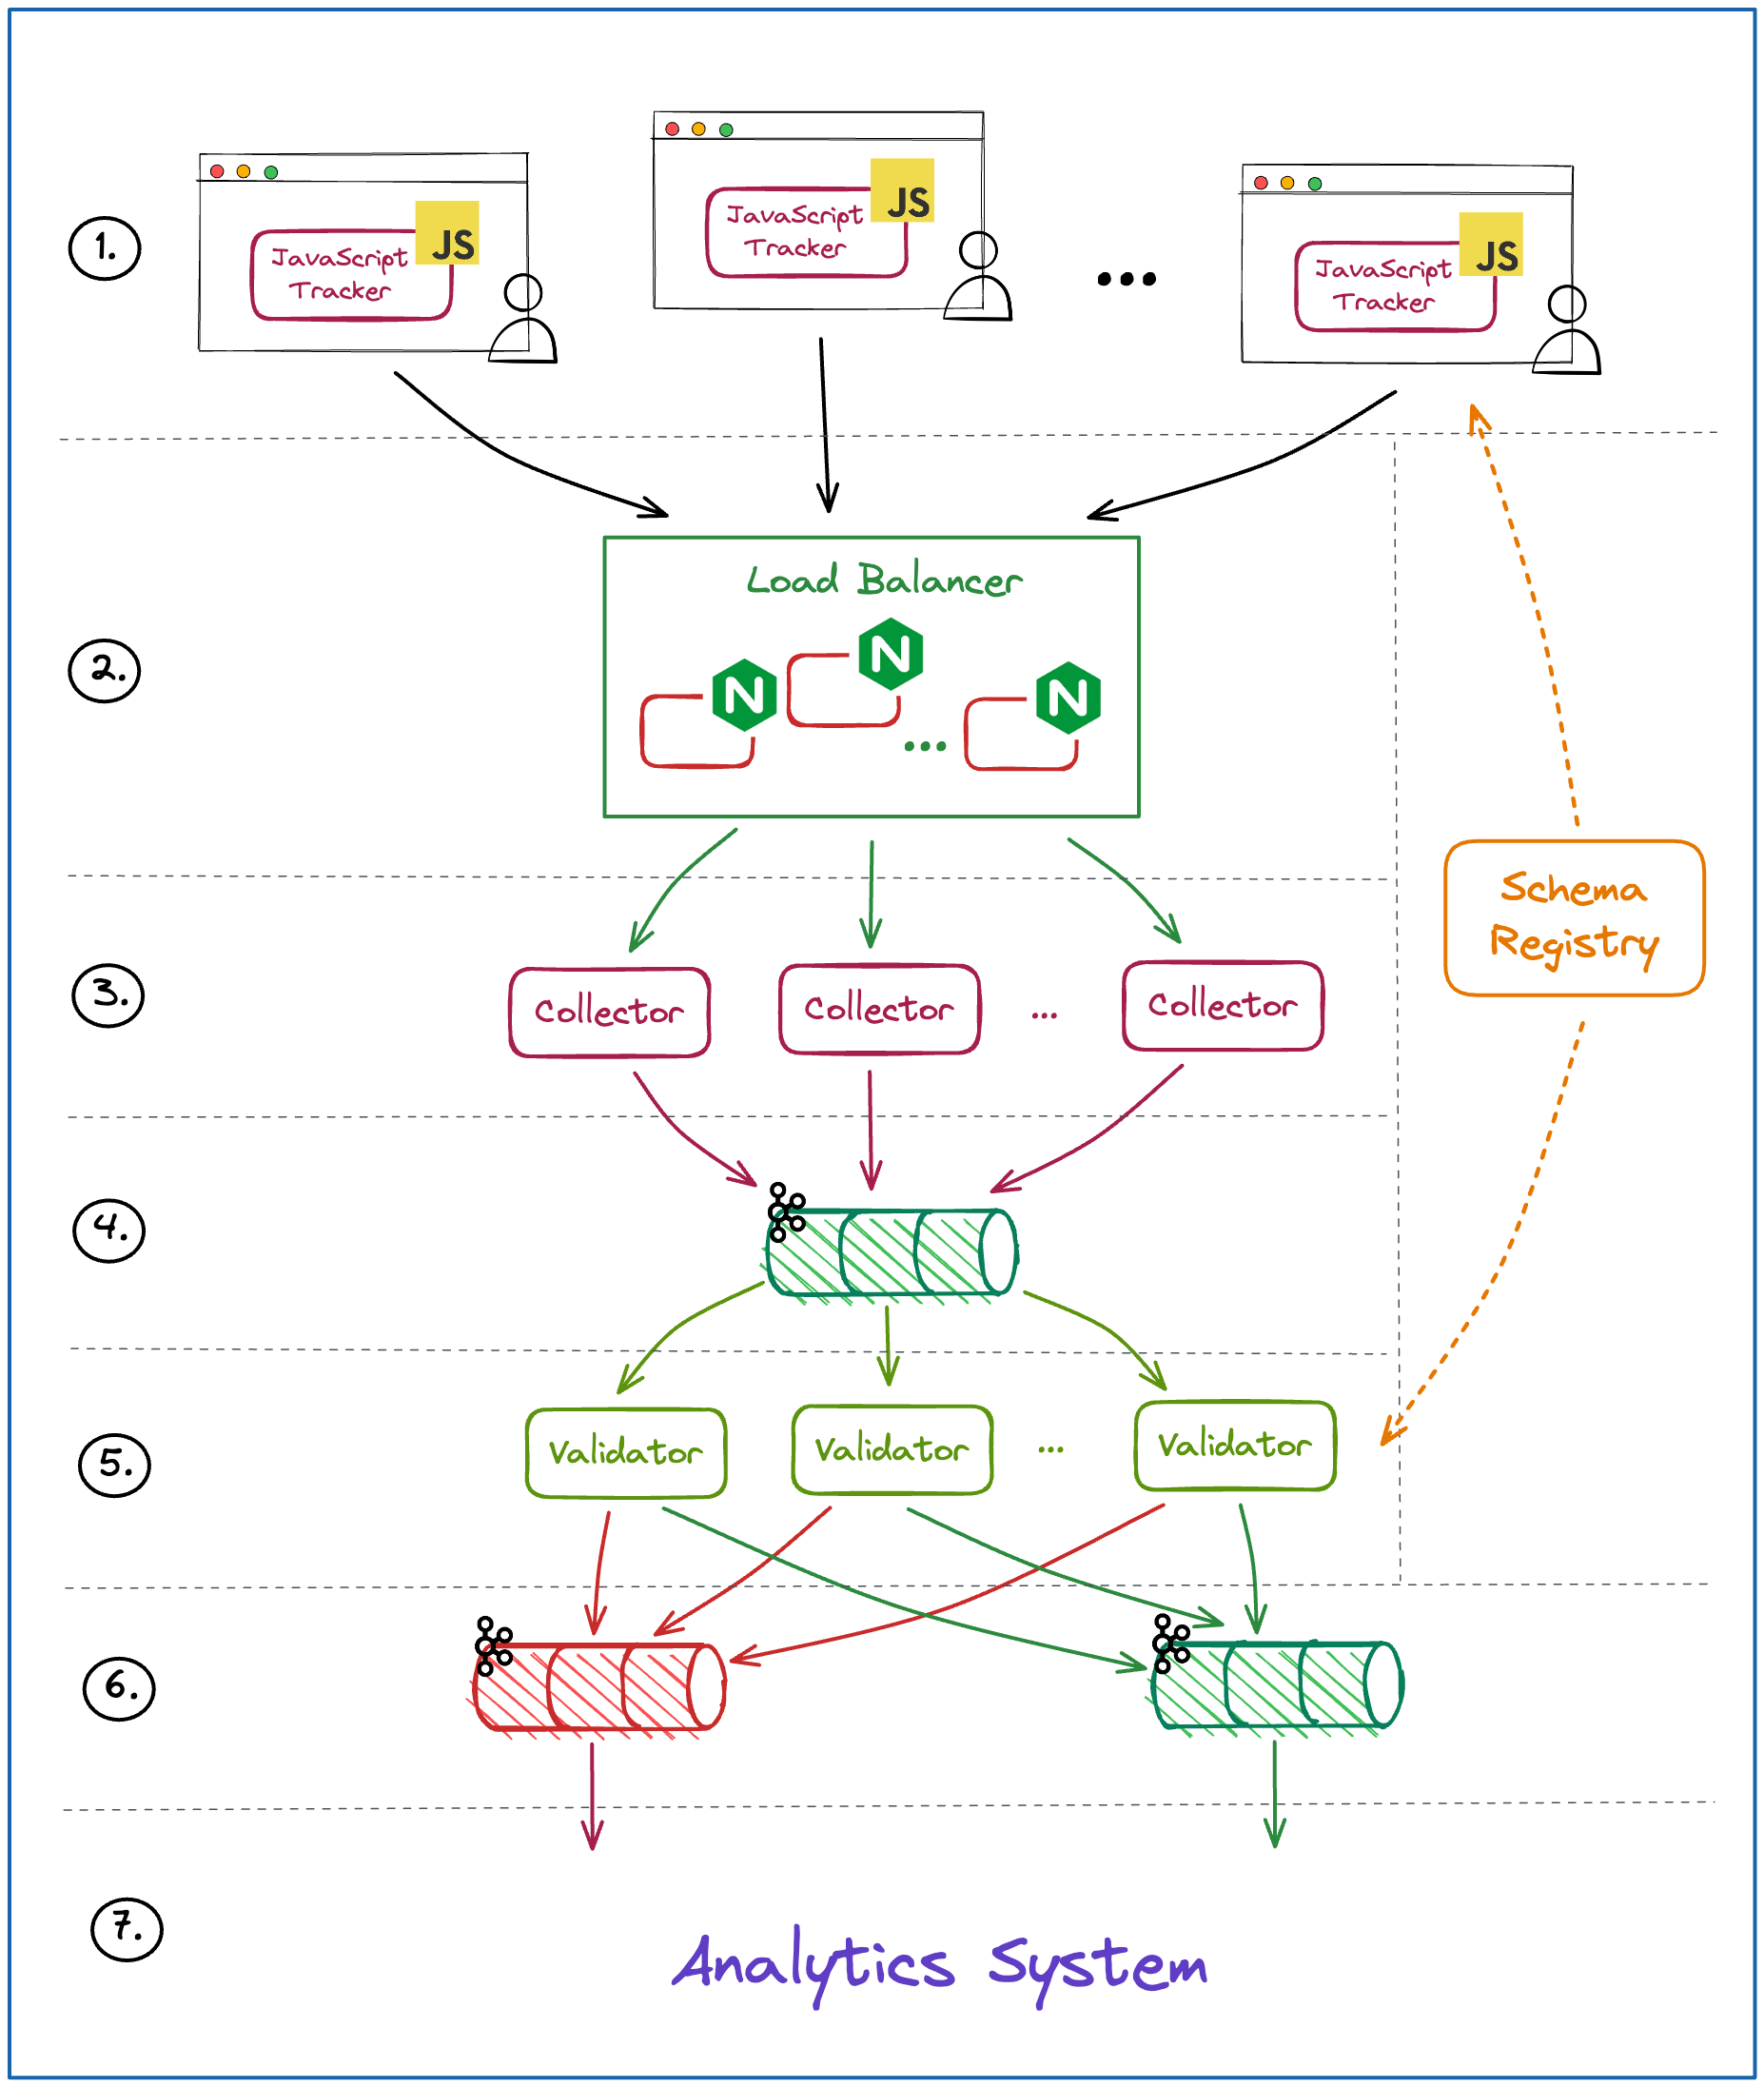
1. - Event Generation.
2. and 3. - Event Collection.
4., 5. and 6. - Transport.
7. in large scale systems will usually include two elements - Data Lake and Data Warehouse.
Let’s look into each group closer.
Generation
This is where the event whose journey we will analyse is being generated. Let’s say we are tracking a click event. A JavaScript library is loaded into the website that will fire an event once a click happens. Event generation timestamp is usually called event_timestamp so we will use this naming as well. What should we know about any added latency?
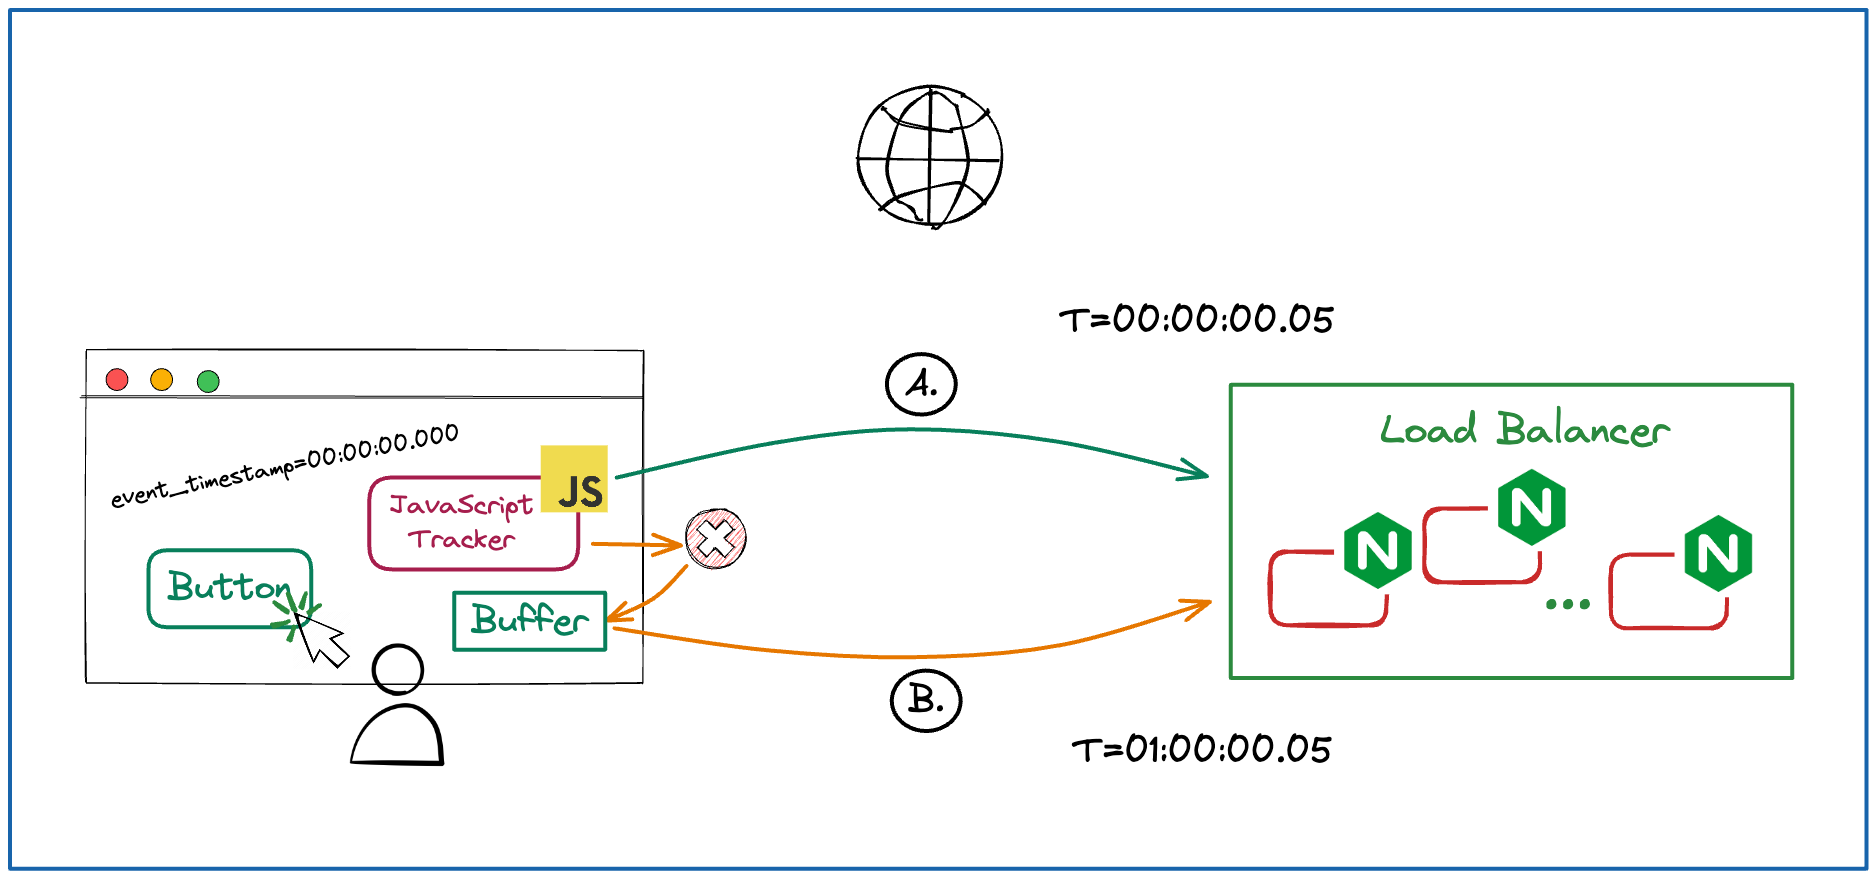
The event will have to be sent over the network to the exposed endpoint of the next Data System step which is usually a Load Balancer facing a fleet of collectors. This will add the network latency of some milliseconds depending on the distance between where the Load Balancers are deployed and where the event was generated. In the diagram ( A. ) we assume it is 50 ms, but it is a really naive assumption, it could be a lot more depending on your location.
Usual culprit of extra Latency is network availability. If a device in which the event was generated does not have network connectivity it will usually buffer ( B. ) the event locally and only send it out once the connectivity is restored. This can be anywhere between fem minutes and hours of additional latency, a good example is a plane flight when you turn on a flight mode in your device, the duration of the flight will vary.
Collection
Collectors are applications that act as a gateway between the internet and internal Data System. The function of these applications is to validate incoming events against some top level schema and buffer them in memory for certain time in case the downstream systems (raw event Kafka Topic) stop responding.

Usually at this point the latency of additional network hops between applications will decrease to single digits of milliseconds ( A. ) as internal applications will be deployed close to each other, in cloud terms - in the single Region and very likely Availability Zone.
If a downstream Kafka stops responding ( B. ), collector starts buffering events to avoid data loss, unfortunately data volume coming in here is huge and collectors might be able to buffer data for few minutes before starting to evict it causing permanent loss. If Kafka is recovered in time, we might see additional latencies of few minutes.
Transport
In the transport layer of the pipeline a streaming application extracts data from raw data Kafka topic, validates the event against agreed schema and optionally enriches it with additional data.

If validation and enrichment succeeds, the data is pushed to a downstream Kafka topic to be then unloaded into a Data Lake. Enrichment and Validation procedure time will depend on how heavy the transformations are and if they require calling any other external systems, but a simple transformation would be performed sub-second.
If event is invalidated or the enrichment fails, it is sent to a so called dead letter topic from which a different application might read the event and retry validation/enrichment. Depending on the setup it might be done instantly or after a predefined time.
Additional latency that will creep in at this stage is due to scaling issues. If the data that is piped to the raw data stream suddenly increases in volume and the Validator application is not scaled appropriately, the consumption will start lagging behind and additional event latency will be generated due to Kafka processing lag. It will differ according to the data volume coming in and can be mitigated by scaling of the Validator application.

Data Lake
Data Lake element can be split into two parts.
Data Loading
Unloading the data from a validated data Kafka stream to HDFS or object storage. The added latency here is sometimes tricky to estimate.

The data is read from validated data Topic and buffered in memory until a certain condition is met and then serialised and written to HDFS or object storage.
Condition for buffering is usually set so that serialisation kicks off after the buffer reaches certain size or when it has been collecting events for a certain time. A good practice is to have both thresholds set at the same time, it prevents situations when data volume is too low for the serialisation to happen for a long time.
Added latency depends on when the event lands in the buffer. If it happens right after the previous buffer has ben serialised, the added latency is the amount of time it will take for a new buffer to fill or a different type of threshold to be reached.
Additionally, the loader is also a Kafka consumer so any Kafka consumer lag adds up like in validation stage of previous pipeline step.
Data is usually serialised into one of the following formats: parquet, lzo or ORC. Amount of time needed for serialisation will depend on the format and if additional compression is applied.
Data Transformations
Additional batch transformations are performed on the data once it is loaded to the landing zone of the Data Lake. Usual procedure would be the following:
An orchestrator schedules a Spark application to run every n hours (e.g. every 2 hours).
The first ETL of the day would be scheduled somewhere around midnight depending on expected data latency.
Time to run the ETL until the data is transformed into Golden datasets will vary depending on the amount of data, processing cluster size, cluster spin up time etc. Let’s assume it takes 1 hour.
For an event that was generated at T=00:00:00 there are few possible scenarios:
Data point gets picked up with the first ETL of the day. Let’s say event of interest lands in the raw enriched data bucket at T=00:00:15.055, which is a fair assumption given that the upstream pipeline did not misbehave in any way and the data volume is large enough to hit the thresholds of serialisation in previous pipeline step. This would cause the event to be picked up by a e.g. Spark job at T=00:30:00.000, processing would take 1 hour and the event would be available for consumption via Data Lake at around T=01:30:00.000

For multiple reasons the serialisation of the event that was generated at T=00:00:00.000 can be delayed. It could be either Kafka consumer lag due to data volume being too high or parquet serialisation not kicking in soon enough due to event volume being too low. Either way, if the event of interest lands in the raw enriched data bucket at e.g. T=00:00:35.055 then it will not be picked up by the first ETL of the day and will be processed only at T=02:30:00.000 and fully processed and available for consumption at T=03:30:00.000.

Important: a misbehaviour of the pipeline in steps 1. to 6. can easily cause the event to be only processed in ETL batch that is completed at T=05:30:00.000 and even later, this could cause breaches in agreed SLAs.
Data Warehouse
Data will be consumed either directly from Data Lake or will be loaded into a Data Warehouse for further processing and transformations.
We will not explore the Data Warehouse in this Newsletter episode as it follows similar pattern with the Data Lake. The data is loaded from the Data Lake and additional transformations are applied on top, this adds additional data latency dependent on the system your Data Warehouse is built on, the amount of data being processed and the types of transformations needed to achieve the final result.
Conclusion
Data latency can unexpectedly increase in every stage of the Data Pipeline. It is important to be able to decompose the system into smaller pieces in order to understand the bottlenecks and efficiently fix them.
Effective monitoring of each component is necessary to avoid unexpected breaches in SLAs. Unfortunately, some of the situations that cause additional latency can not be prevented, e.g. network unavailability in the device that is generating events of interest.
[Note]: all of the latency numbers are dummy numbers and might not represent your reality, you should not rely on them when evaluating your system.
Join SwirlAI Data Talent Collective
If you are looking to fill your Hiring Pipeline with Data Talent or you are looking for a new job opportunity in the Data Space check out SwirlAI Data Talent Collective! Find out how it works by following the link below.